XAU/USD Pre-NY Analysis Friday April 10 - Gold at $4,756, Bullish bias
XAU/USD at $4,756. 4H Structure ACCUMULATION. Wyckoff: transition. 2 active setups. Score +1.

Summary
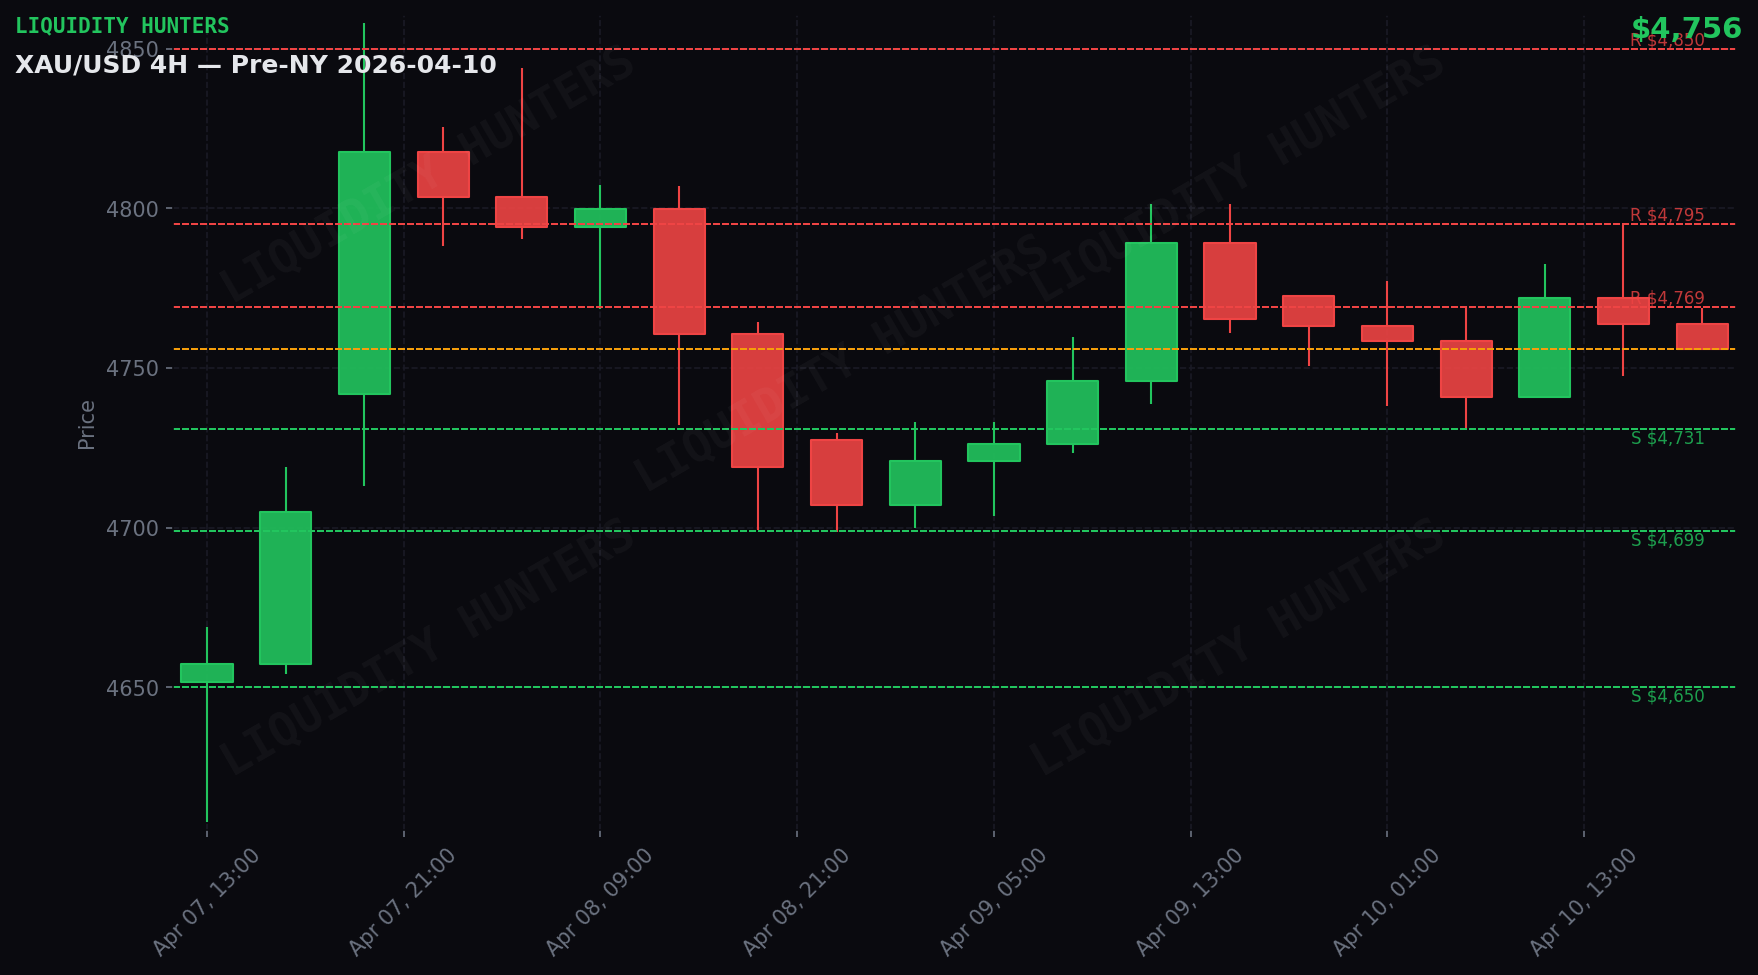
Gold fell 0.2% and closed at $4,756. It was a day of moderate movement — the price moved $64 between its lowest point ($4,731) and highest ($4,795).
The trend points upward (score +1), but with caution. If it loses support, the reading changes.
Why? Bond yields are rising (bad for gold).
Premium content
Want the exact entry setups?
Subscribers receive before each session: exact entry and exit points, institutional liquidity map, and macro event alerts. You arrive at the market with a plan.
Technical analysis
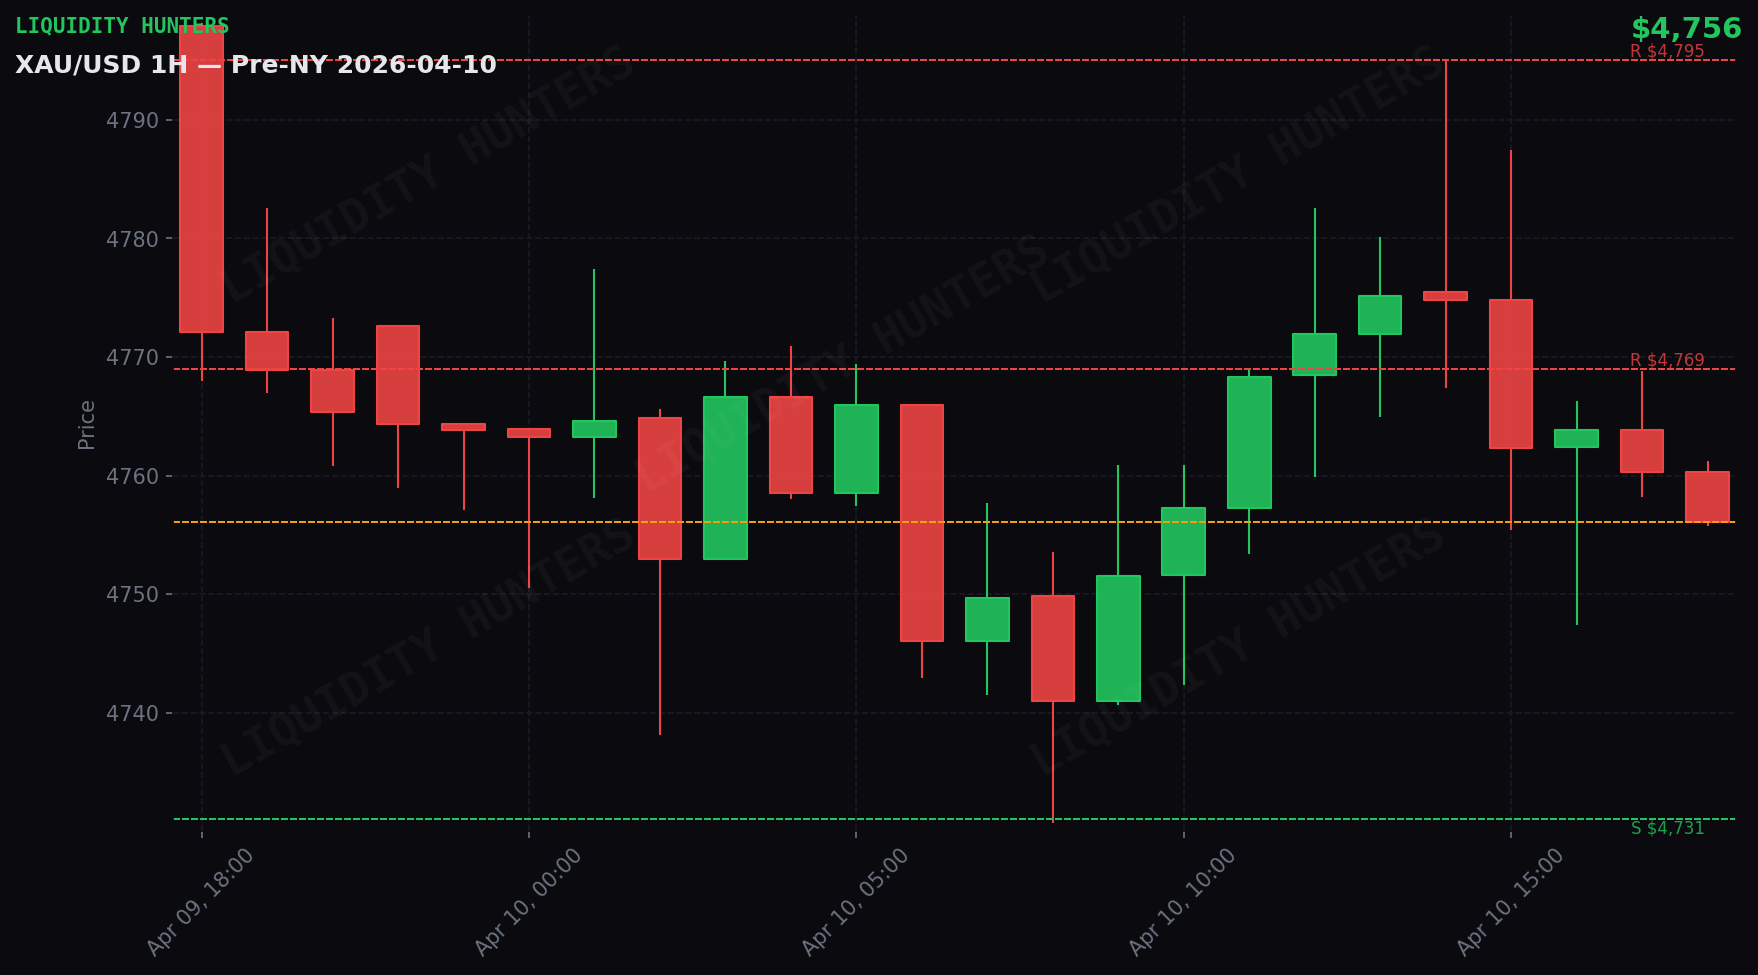
Gold closed Friday April 10 at $4,756 (down 0.20%). Structure 4H: ACCUMULATION. Wyckoff Ranging. Daily range: $64 ($4,731 - $4,795). Score: +1 BULLISH.
The day in detail
Act 1 — Asia (21:00-04:00 Chile): Gold fell $18 (0.4%), from $4,764 to $4,746. Moderate range of $39.
Act 2 — London (04:00-09:00 Chile): Gold rose $22 (0.5%), from $4,746 to $4,768. Moderate range of $38.
Act 3 — NY (09:00-16:00 Chile): Gold fell $12 (0.3%), from $4,768 to $4,756. Moderate range of $48. NY returned 56% of London’s rally — normal pullback.
Volatility ELEVATED
Daily ATR $173 vs normal $147 (1.2x). Movements are faster and sweeps more aggressive. SL adjusted x1.25, reduced risk.
Correlations
DXY neutral (-0.08%) — no significant direct pressure.
Yields rising (+0.93%) — pressure on Gold. Higher bond yields compete directly with gold.
Market Maker
Institutions are accumulating on pullbacks. Liquidity sweeps are buying opportunities, not signs of weakness.
The complete Market Maker reading (BSL/SSL, institutional game and scenarios) is available in the premium plan.
Scenarios
Scenario 1 — Healthy pullback and continuation (50%): Gold pulls back to support zone $4,731-$4,736 and bounces. Buyers defend support. Continuation towards next resistance.
Scenario 2 — Range consolidation (30%): Gold stays between support-next resistance without clear direction. Volume drops.
Scenario 3 — Support breakdown (20%): Gold loses support zone with 1H close below. Return to $4,699. Cancel longs.
What to do
2 active setups. Favorite: LONG Pullback to support. Exact entry, SL and TP available in the premium plan.
The day’s key support is the line of defense. If it holds, bullish continuation. If it breaks with 1H close, cancel longs. Exact levels in the premium plan.
Analysis generated by the Liquidity Hunters team. This analysis is educational and is not financial advice. Trading carries the risk of capital loss.
Pre-session reports with entry setups
Before every session you get the likely setups with exact entry, SL and TP, correlations with DXY, Oil and Yields, macro news of the day, and a liquidity map. You reach the market with a plan.
Disclaimer
Educational and informational content. This is not financial advice or a buy/sell recommendation. Trading involves risk of capital loss. Past results do not guarantee future results. Do your own research (DYOR).