XAU/USD Analysis Pre-Asia Wed April 15 - Gold at $4,825, Bullish bias
XAU/USD at $4,825. 4H Structure BULLISH. Wyckoff: transition. 2 active setups. Score +4.

Summary
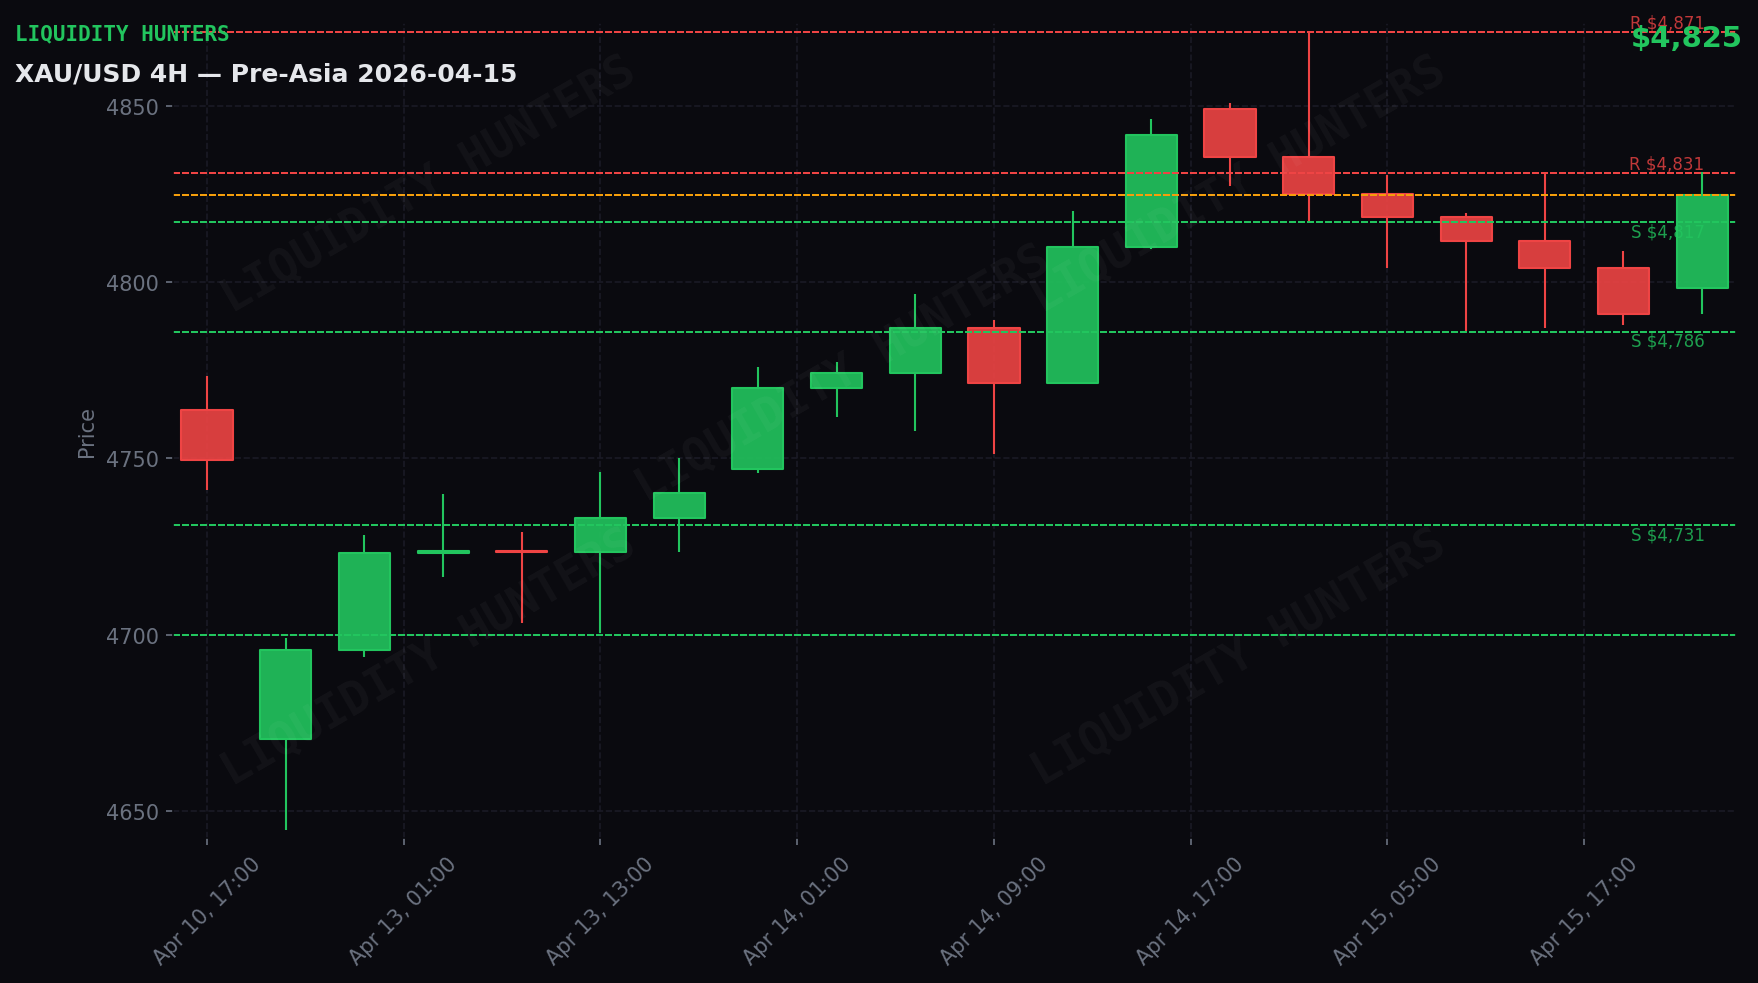
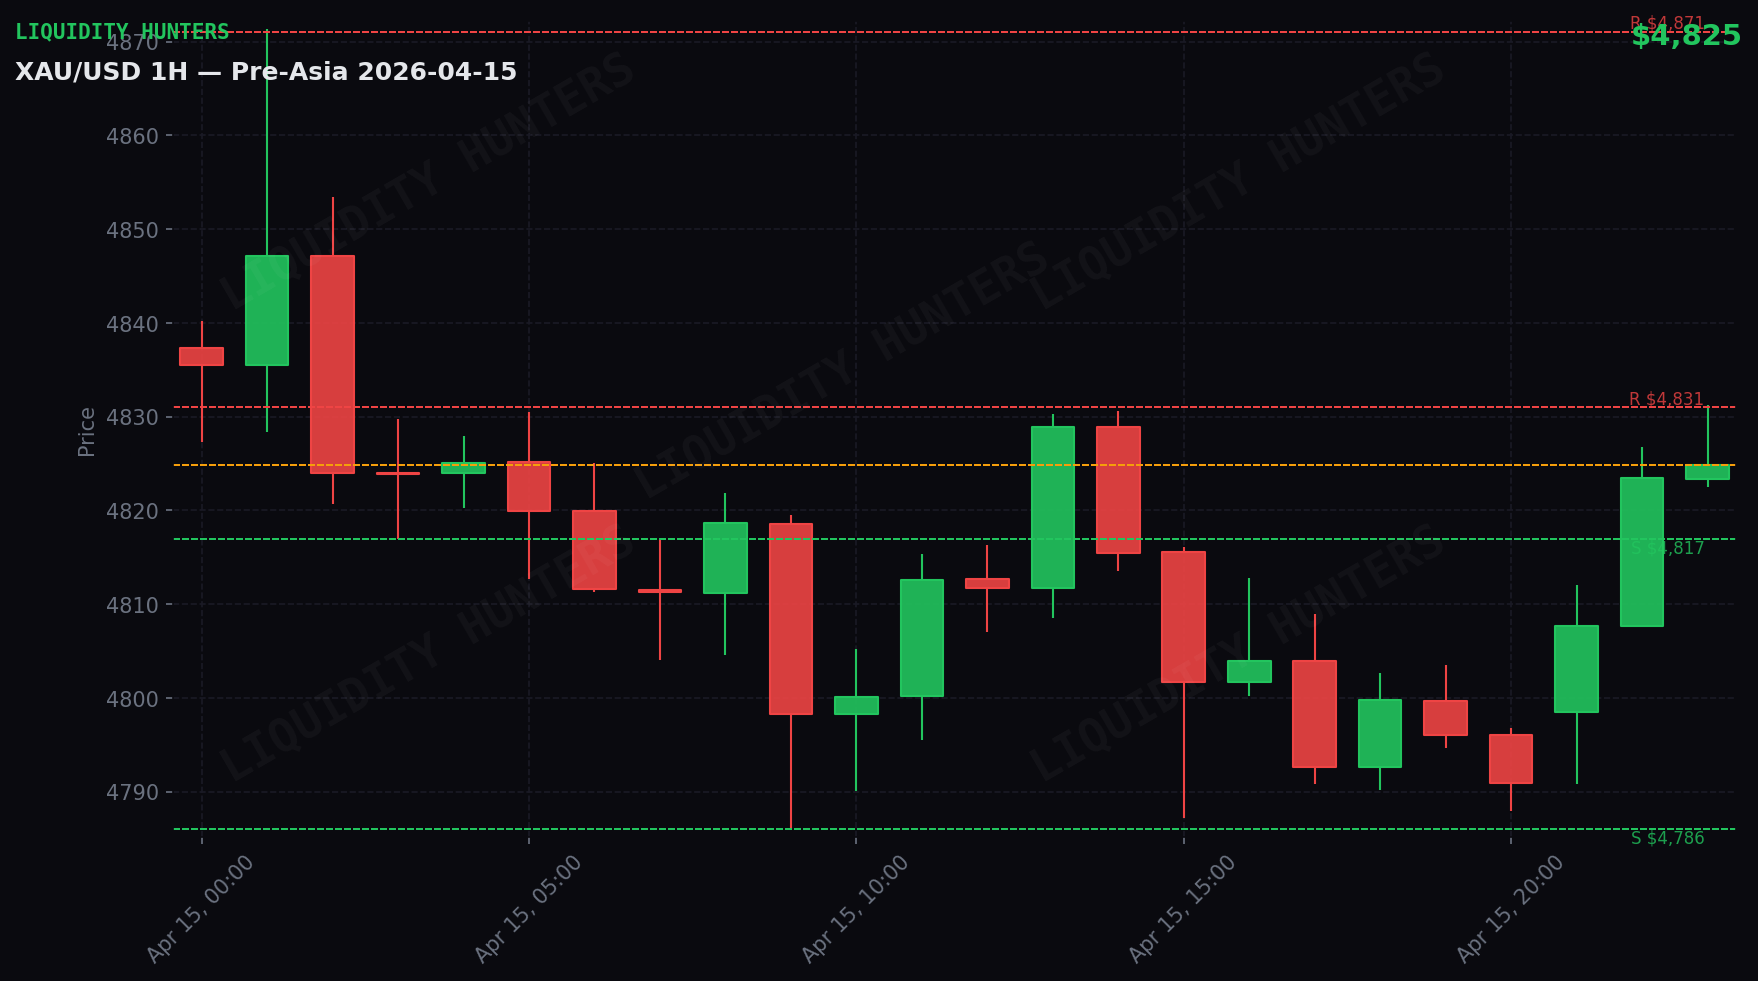
Gold rose 0.7% and closed at $4,825. It was a day of moderate movement — the price moved $44 between its lowest point ($4,787) and highest ($4,831).
The trend is bullish (high confidence, score +4). Large institutions are buying on pullbacks. If the price holds above key support, it’s likely to rise in the coming sessions.
Premium content
Want the exact entry setups?
Subscribers receive before each session: exact entry and exit points, institutional liquidity map, and macro event alerts. You arrive at the market with a plan.
Technical analysis
Gold closed on Wed April 15 at $4,825 (up 0.71%). Structure 4H: BULLISH. Wyckoff Ranging. Day range: $44 ($4,787 - $4,831). Score: +4 BULLISH.
Day in detail
Act 1 — Asia (21:00-04:00 Chile): Quiet session. Gold moved only $20 ($4,811-$4,831). No relevant moves. Typical Asia compression — energy accumulating for London.
Act 2 — London (04:00-09:00 Chile): Gold rose $1 (0.0%), from $4,812 to $4,813. Moderate range of $35.
Act 3 — NY (09:00-16:00 Chile): Gold fell $13 (0.3%), from $4,813 to $4,800. Moderate range of $43. NY completely reversed London’s rally and extended the decline ($13 vs $1 of gains).
Act 4 — Close (16:00-21:00 Chile): Gold rose $24 (0.5%), from $4,800 to $4,823. Moderate range of $39.
Correlations
DXY neutral (-0.04%) — no significant direct pressure.
Market Maker
Institutions are accumulating on pullbacks. Liquidity sweeps are buying opportunities, not signs of weakness.
The full Market Maker reading (BSL/SSL, institutional play and scenarios) is available in the premium plan.
Scenarios
Scenario 1 — Healthy pullback and continuation (50%): Gold pulls back to support zone-$4,805 and bounces. Buyers defend support. Continuation toward next resistance.
Scenario 2 — Range consolidation (30%): Gold stays between support-next resistance zone without clear direction. Volume drops.
Scenario 3 — Support break (20%): Gold loses support zone with 1H close below. Return to $4,786. Cancel longs.
What to do
2 active setups. Favorite: LONG Resistance breakout. Exact Entry, SL and TP available in the premium plan.
The key support of the day is the line of defense. If it holds, bullish continuation. If it breaks with 1H close, cancel longs. Exact levels in the premium plan.
Analysis generated by the Liquidity Hunters team. This analysis is educational and is not financial advice. Trading carries the risk of capital loss.
Pre-session reports with entry setups
Before every session you get the likely setups with exact entry, SL and TP, correlations with DXY, Oil and Yields, macro news of the day, and a liquidity map. You reach the market with a plan.
Disclaimer
Educational and informational content. This is not financial advice or a buy/sell recommendation. Trading involves risk of capital loss. Past results do not guarantee future results. Do your own research (DYOR).