XAU/USD Post-Session Analysis Mon April 13 - Gold at $4,756, Bullish bias
XAU/USD at $4,756. 4H Structure BULLISH. Wyckoff: transition. 1 active setups. Score +7.

Summary
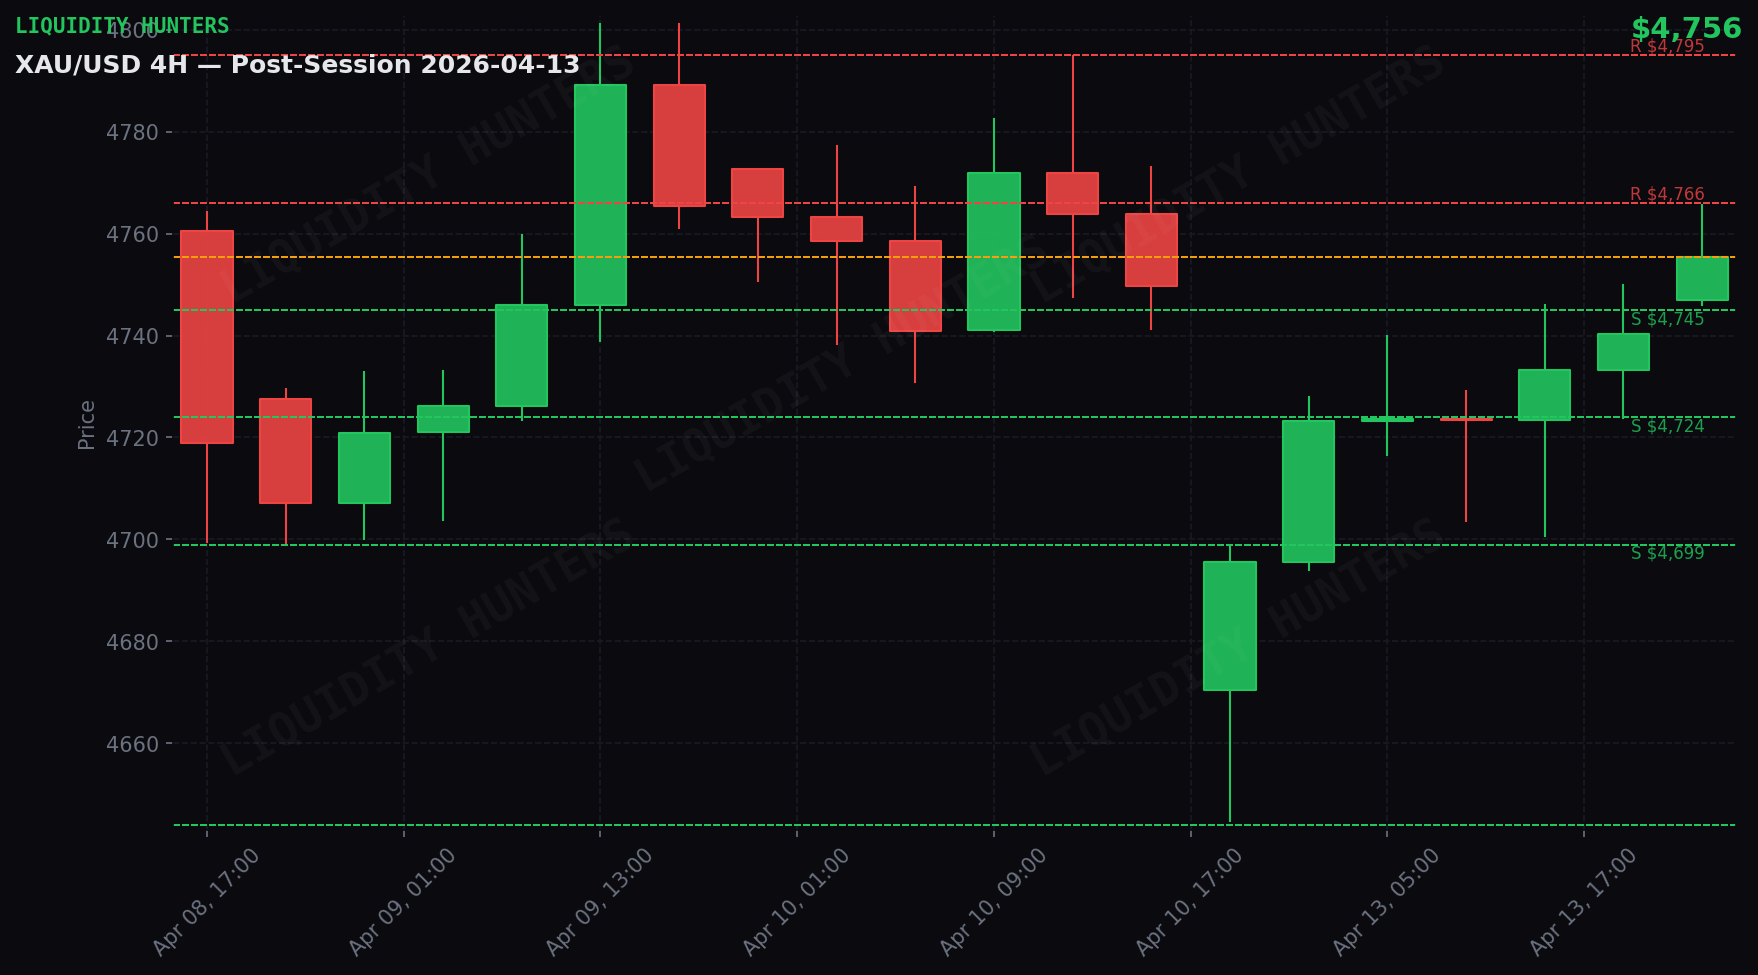
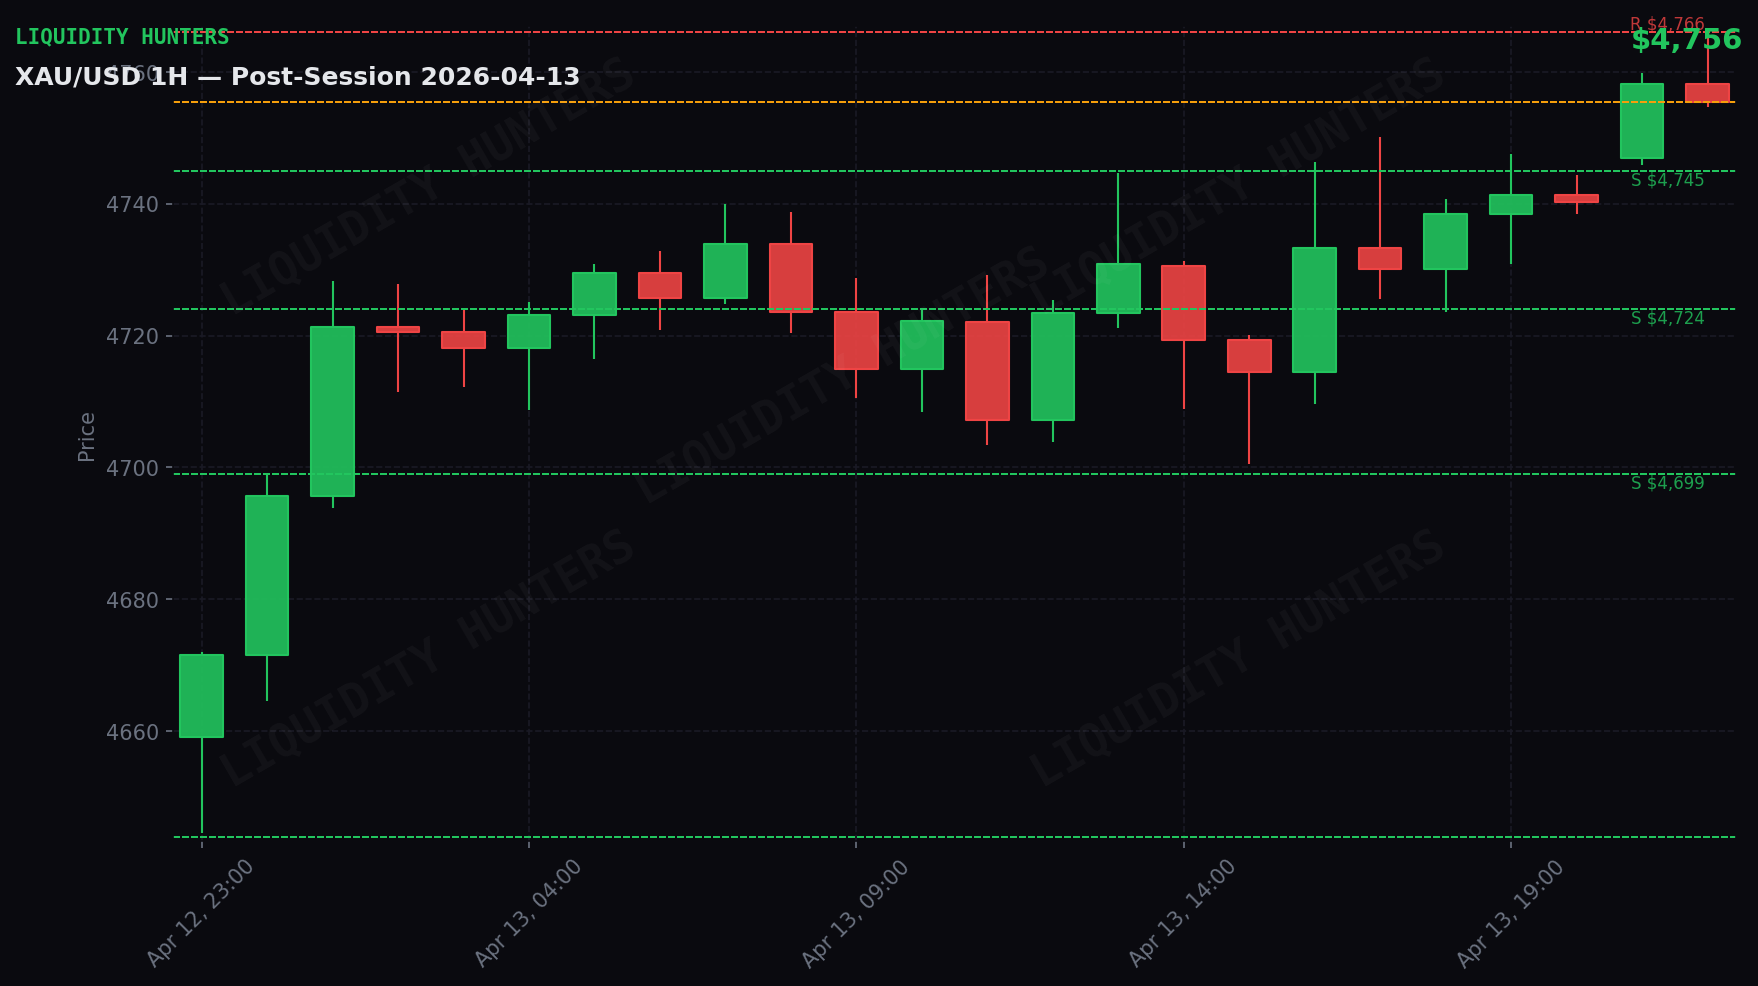
Gold rose 0.3% and closed at $4,756. It was a day of moderate movement — the price moved $65 between its lowest point ($4,701) and highest ($4,766).
The trend is bullish (high confidence, score +7). Major institutions are buying on pullbacks. If the price holds above key support, it’s likely to rise in the coming sessions.
Why? Bond yields are declining (good for gold, because gold competes with bonds); the dollar is weakening (positive for gold).
Premium content
Want the exact entry setups?
Subscribers receive before each session: exact entry and exit points, institutional liquidity map, and macro event alerts. You arrive at the market with a plan.
Technical Analysis
Gold closed on Monday, April 13 at $4,756 (up 0.32%). Structure 4H: BULLISH. Wyckoff Ranging. Day range: $65 ($4,701 - $4,766). Score: +7 BULLISH.
The day in detail
Act 1 — Asia (21:00-04:00 Chile): Gold rose $54 (1.2%), from $4,671 to $4,726. Moderate range of $32.
Act 2 — London (04:00-09:00 Chile): Gold fell $19 (0.4%), from $4,726 to $4,707. Moderate range of $37.
Act 3 — NY (09:00-16:00 Chile): Gold rose $31 (0.7%), from $4,707 to $4,738. Moderate range of $50.
Act 4 — Close (16:00-21:00 Chile): Gold rose $17 (0.4%), from $4,738 to $4,756. Moderate range of $35.
Correlations
DXY declining (-0.33%) — dollar weakness favors Gold. Inverse correlation active. While DXY continues to weaken, Gold has tailwinds.
Yields declining (-0.69%) — positive for Gold. Lower bond yields favor yield-less assets like gold.
Market Maker
Institutions are accumulating on pullbacks. Liquidity sweeps are buying opportunities, not signs of weakness.
The complete Market Maker reading (BSL/SSL, institutional play and scenarios) is available in the premium plan.
Scenarios
Scenario 1 — Healthy pullback and continuation (50%): Gold retraces to support zone at $4,745-$4,736 and bounces. Buyers defend support. Continuation towards next resistance.
Scenario 2 — Range consolidation (30%): Gold stays between support and next resistance without clear direction. Volume declines.
Scenario 3 — Support breakdown (20%): Gold loses support at $4,745 with 1H close below. Retest of $4,724. Cancel longs.
What to do
1 active setups. Favorite: LONG Resistance breakout. Entry, SL and TP exact levels available in the premium plan.
The key support of the day is the line of defense. If it holds, bullish continuation. If it breaks with 1H close below, cancel longs. Exact levels in the premium plan.
Analysis generated by the Liquidity Hunters team. This analysis is educational and is not financial advice. Trading carries the risk of capital loss.
Pre-session reports with entry setups
Before every session you get the likely setups with exact entry, SL and TP, correlations with DXY, Oil and Yields, macro news of the day, and a liquidity map. You reach the market with a plan.
Disclaimer
Educational and informational content. This is not financial advice or a buy/sell recommendation. Trading involves risk of capital loss. Past results do not guarantee future results. Do your own research (DYOR).