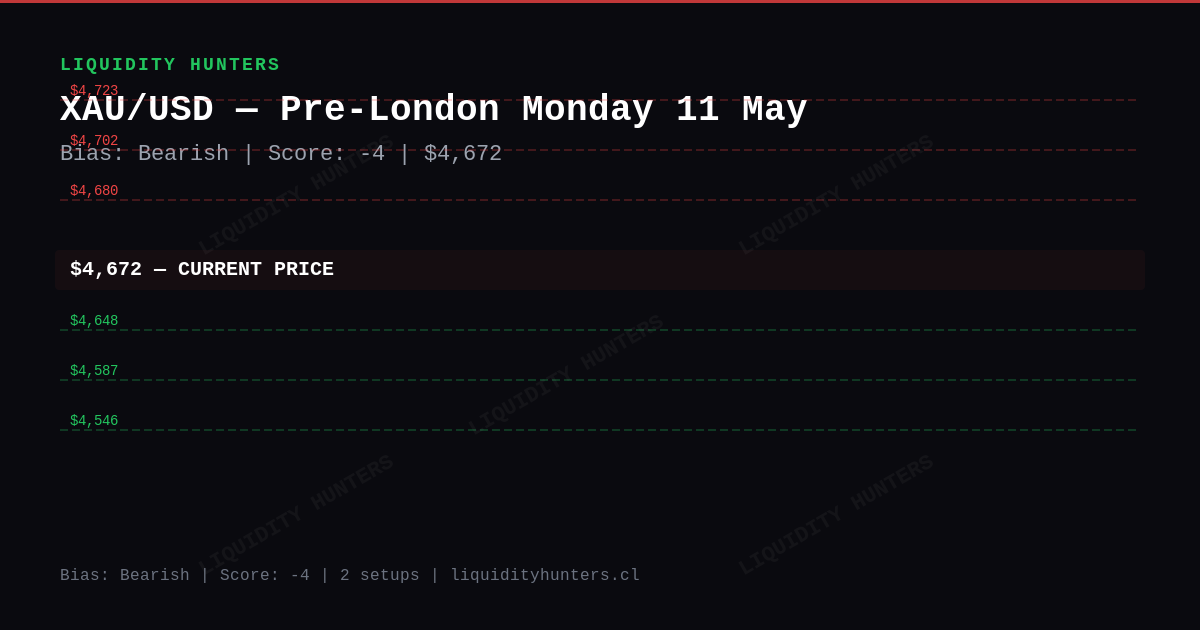
XAU/USD SMC/ICT Analysis Today — Pre-London Setup (May 11)
Key levels: R $4,680 / S $4,648. XAU/USD SMC/ICT analysis for Pre-London session (May 11, 2026). Bearish bias, score -4. 2 active setups. Watch CPI May 13.
Frequently Asked Questions
What is the XAU/USD bias for the Pre-London session today?
XAU/USD shows a bearish bias with score -4/10. Wyckoff phase is transition. Trade with the structural direction. Current price sits at $4,672.
What are the key resistance and support levels for XAU/USD today?
Immediate resistance sits at $4,680. Key support is $4,648. Higher resistance extends toward $4,750. Deeper liquidity pool near $4,500. Watch for reaction at each level for SMC/ICT confirmations.
What is the main XAU/USD short setup for the Pre-London killzone?
Main setup: SHORT — Pullback to resistance. Entry $4,750, SL $4,780, TP1 $4,648 (1:3.4). Trigger: Bearish rejection at $4,750. Personalized sizing by account size is in the premium plan.
Where is the invalidation level for today's XAU/USD bias?
The bearish bias invalidates on a clean 1H close above $4,750 or below $4,500. Until then, trade with the structure. Avoid counter-trend entries without a CHoCH confirmation on M15 or higher.
What macro drivers are affecting XAU/USD today?
**DXY neutral (+0.13%)** — no significant direct pressure.
In summary
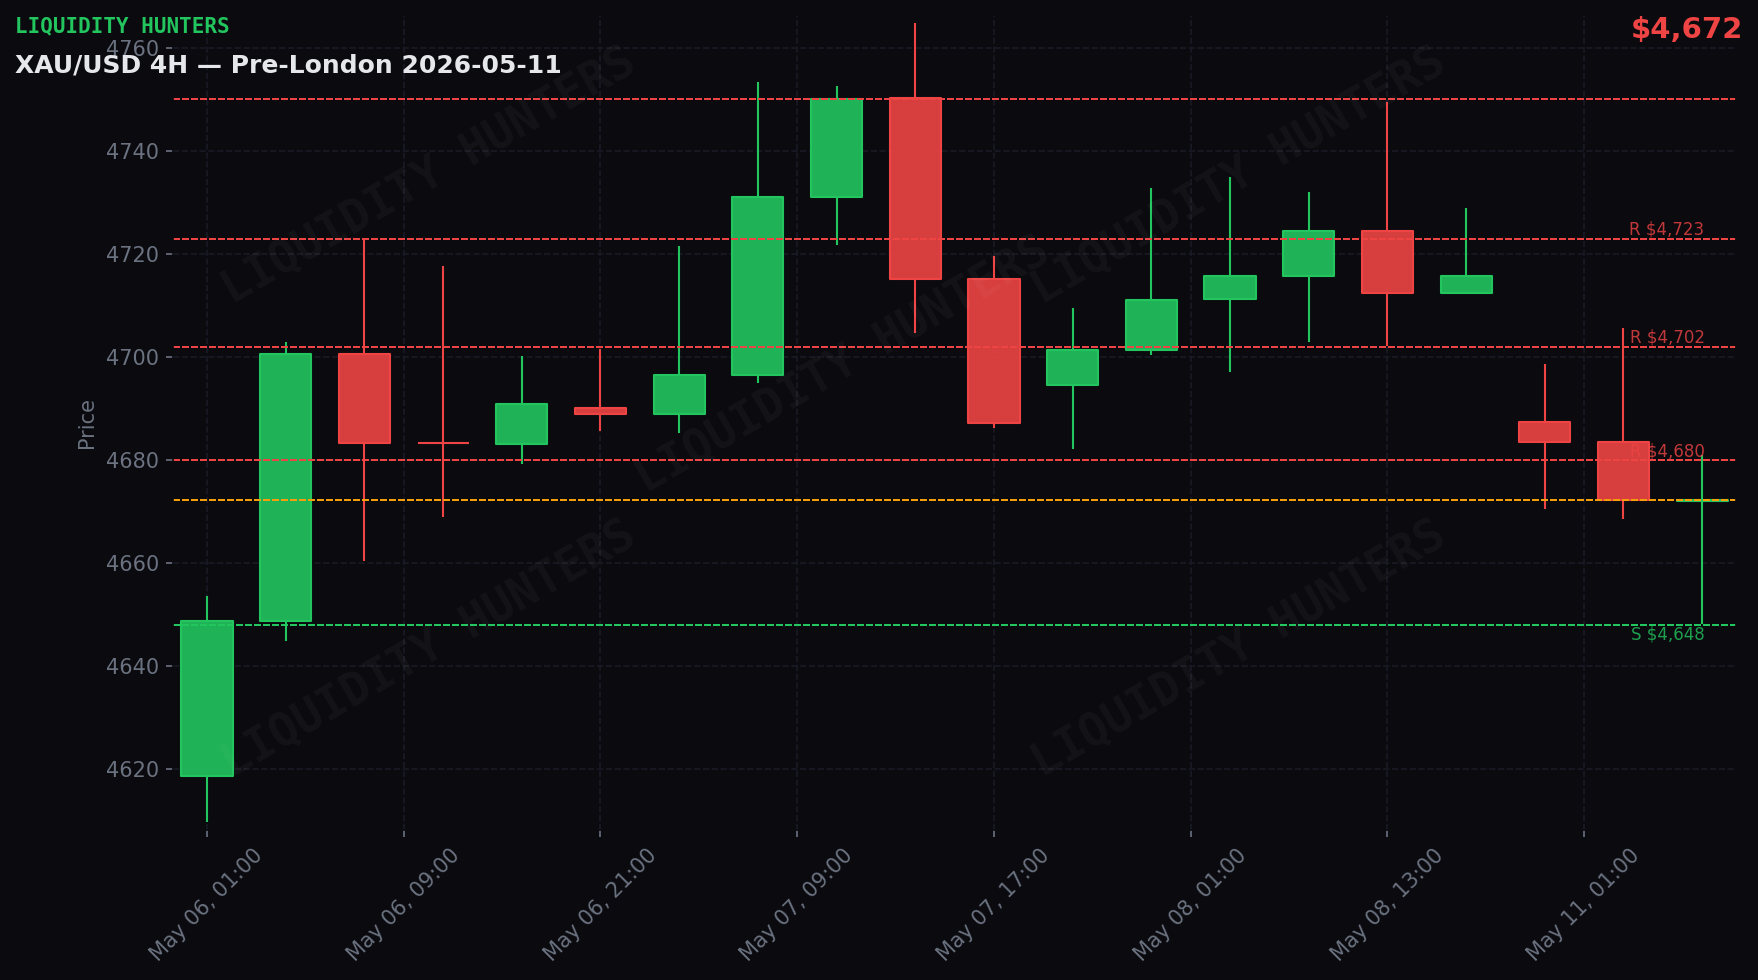
Gold fell 0.9% and closed at $4,672. It was a moderately active day — price swung $76 between its low ($4,648) and high ($4,724).
The trend is bearish (high conviction, score -4). Sellers are in control. If resistance isn’t reclaimed, more downside is likely.
Why? bond yields are rising (bad for gold).
Next important event: Consumer Price Index (CPI) (2026-05-13 09:30 Chile). Volatility likely.
Premium content
Want the exact entry setups?
Subscribers receive, before each session, the exact entry and exit levels, institutional liquidity map, and macro event alerts. You reach the market with a plan.
Technical analysis
Gold closed Monday May 11 at $4,672 (fell 0.92%). 4H structure: BEARISH. Wyckoff Ranging. Daily range: $76 ($4,648 - $4,724). Score: -4 Bearish.
The day in detail
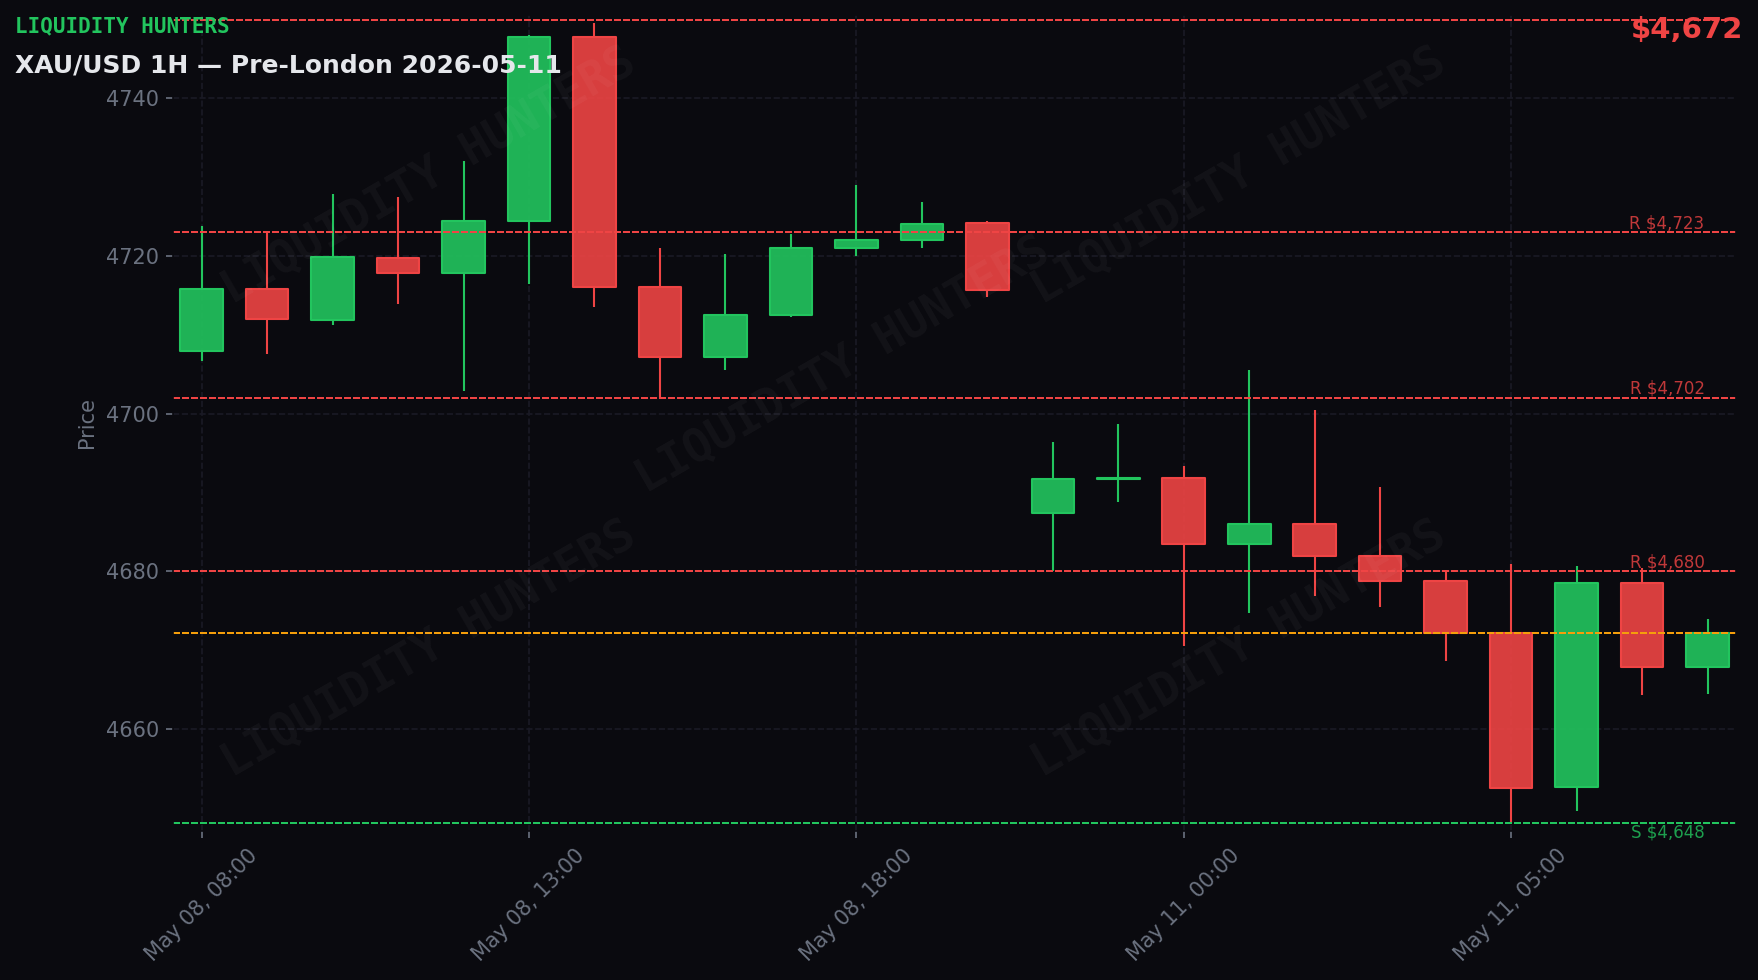
Act 1 — Asia (21:00-04:00 Chile): Bearish pressure. Gold dropped $13 from $4,692 to $4,679. Range of $57 with low at $4,648. The 05:00 UTC candle was the largest ($33 range).
Act 2 — London (04:00-09:00 Chile): Quiet session. Gold moved only $16 ($4,664-$4,680). No relevant moves.
Correlations
DXY neutral (+0.13%) — no significant direct pressure.
Market Maker
BSL (stops of shorts above): $4,724, $4,706, $4,700 SSL (stops of longs below): $4,648, $4,650, $4,664
Price near SSL $4,648. MM may sweep stops below and bounce. Bearish trap likely.
Trade setups
2 active setups. Entries, stops and targets below — all public. One trade only; the favorite is marked. No trigger, no trade.
A. 🔴 SHORT — Pullback to resistance ⭐ Favorite
Entry: $4,750 · SL: $4,780 · TP1: $4,648 · R:R 1:3.4 · Risk: 1%
Trigger: Bearish rejection at $4,750
Confirmations (all required):
- Price rallies to zone $4,750±5 (do not short into the drop)
- Bearish CHoCH on 5m: lower low breaks the last swing low
- 5m rejection candle: upper wick >60% of total range (pin bar or shooting star)
- Bearish displacement: red candle with body >70%, close in lower third
- Resistance $4,750 NOT broken with a 5m close above
Invalid if:
- 5m close above $4,780 → setup dead
- 1H close above $4,750 → resistance broken, cancel short
- If 2 hours pass with no trigger → expired
B. 🔴 SHORT — Support breakdown
Entry: $4,648 · SL: $4,678 · TP1: $4,500 · R:R 1:4.9 · Risk: 0.5-0.75%
Trigger: Breakdown + retest of $4,648
Confirmations (all required):
- 1H candle closes BELOW $4,648 (real close, not a wick)
- Retest: price returns to $4,648±5 and is rejected (1-3 5m candles)
- At the retest: 5m candle with upper wick touches $4,648 and close stays below
- Breakdown volume > average (break candle with body >60%)
- Price does NOT return above $4,648 with a 5m close after the retest
Invalid if:
- 1H close back above $4,648 → fake breakdown, cancel
- 5m close above $4,678 → setup dead
- If no retest within 3 1H candles post-breakdown → expired, do not chase
Scenarios
Scenario 1 — Retest of resistance and rejection (50%): Gold rallies to nearest resistance and gets rejected. Sellers defend resistance. Bearish continuation toward support zone.
Scenario 2 — Range consolidation (30%): Gold stays between support zone-nearest resistance without direction. Wait for a catalyst.
Scenario 3 — Upside breakout (20%): Gold breaks nearest resistance with a 1H close above. Bias changes. Cancel shorts.
What to do
2 active setups — see Trade setups section above for full entries, stops, targets and triggers. Favorite: SHORT Pullback to resistance at $4,750.
Key resistance: $4,680. Rejection = bearish continuation. Break on a 1H close = cancel shorts.
Critical event: Consumer Price Index (CPI) — 2026-05-13 09:30 Chile. Reduce exposure before the release.
Analysis generated by the Liquidity Hunters team. This is educational content and not financial advice. Trading involves risk of capital loss.
What the team says
Our 6 analysts reviewed this report and all raised concerns. No consensus — it’s a tricky day.
The full debate — with the observations of our Structure & Wyckoff, Risk & Management, Macro & Fundamentals, Pure Technical Analysis, Timing & Sessions and Contrarian analysts — is available to premium subscribers.
Tu decides. Nosotros mostramos los datos y los desacuerdos. La decision final siempre es tuya.
Pre-session reports with entry setups
Before every session you get the likely setups with exact entry, SL and TP, correlations with DXY, Oil and Yields, macro news of the day, and a liquidity map. You reach the market with a plan.
Disclaimer
Educational and informational content. This is not financial advice or a buy/sell recommendation. Trading involves risk of capital loss. Past results do not guarantee future results. Do your own research (DYOR).