XAU/USD SMC/ICT Analysis — June 12, 2026 | Pre-London Killzone
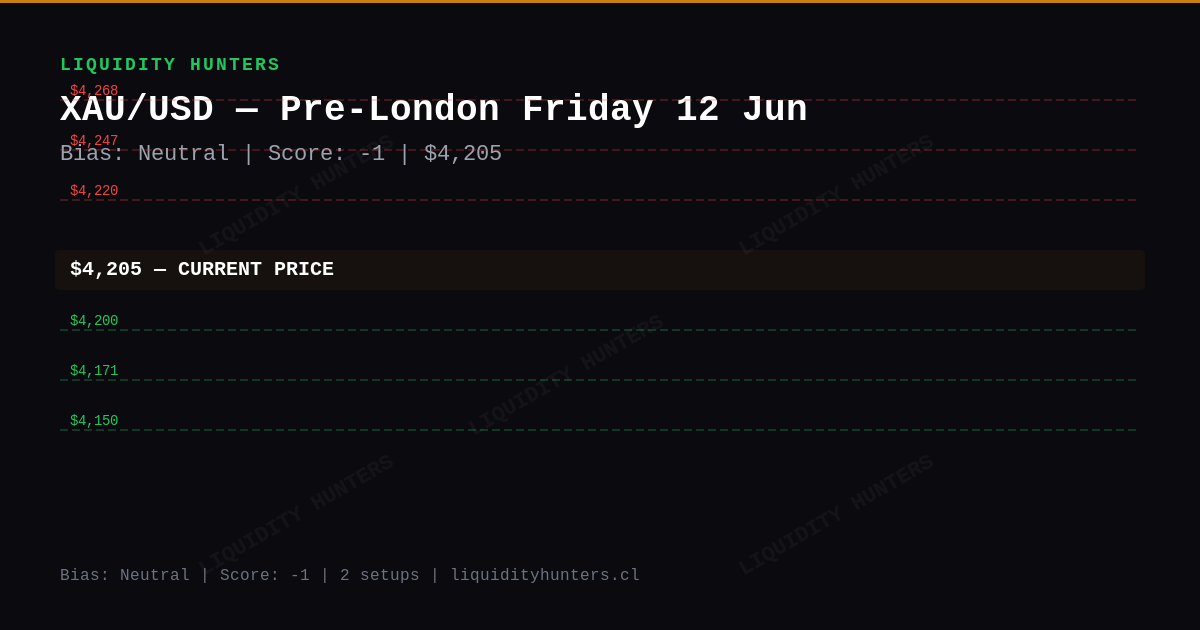
Key levels: R $4,220 / S $4,200. SMC/ICT analysis of XAU/USD for Pre-London session on June 12, 2026. Neutral bias, 2 active setups.
Frequently Asked Questions
What is the XAU/USD bias for today's Pre-London session?
XAU/USD shows a neutral bias with score -1/10. The Wyckoff phase is transition. Trade with the structural direction. Current price is $4,205.
What are the key resistance and support levels for XAU/USD today?
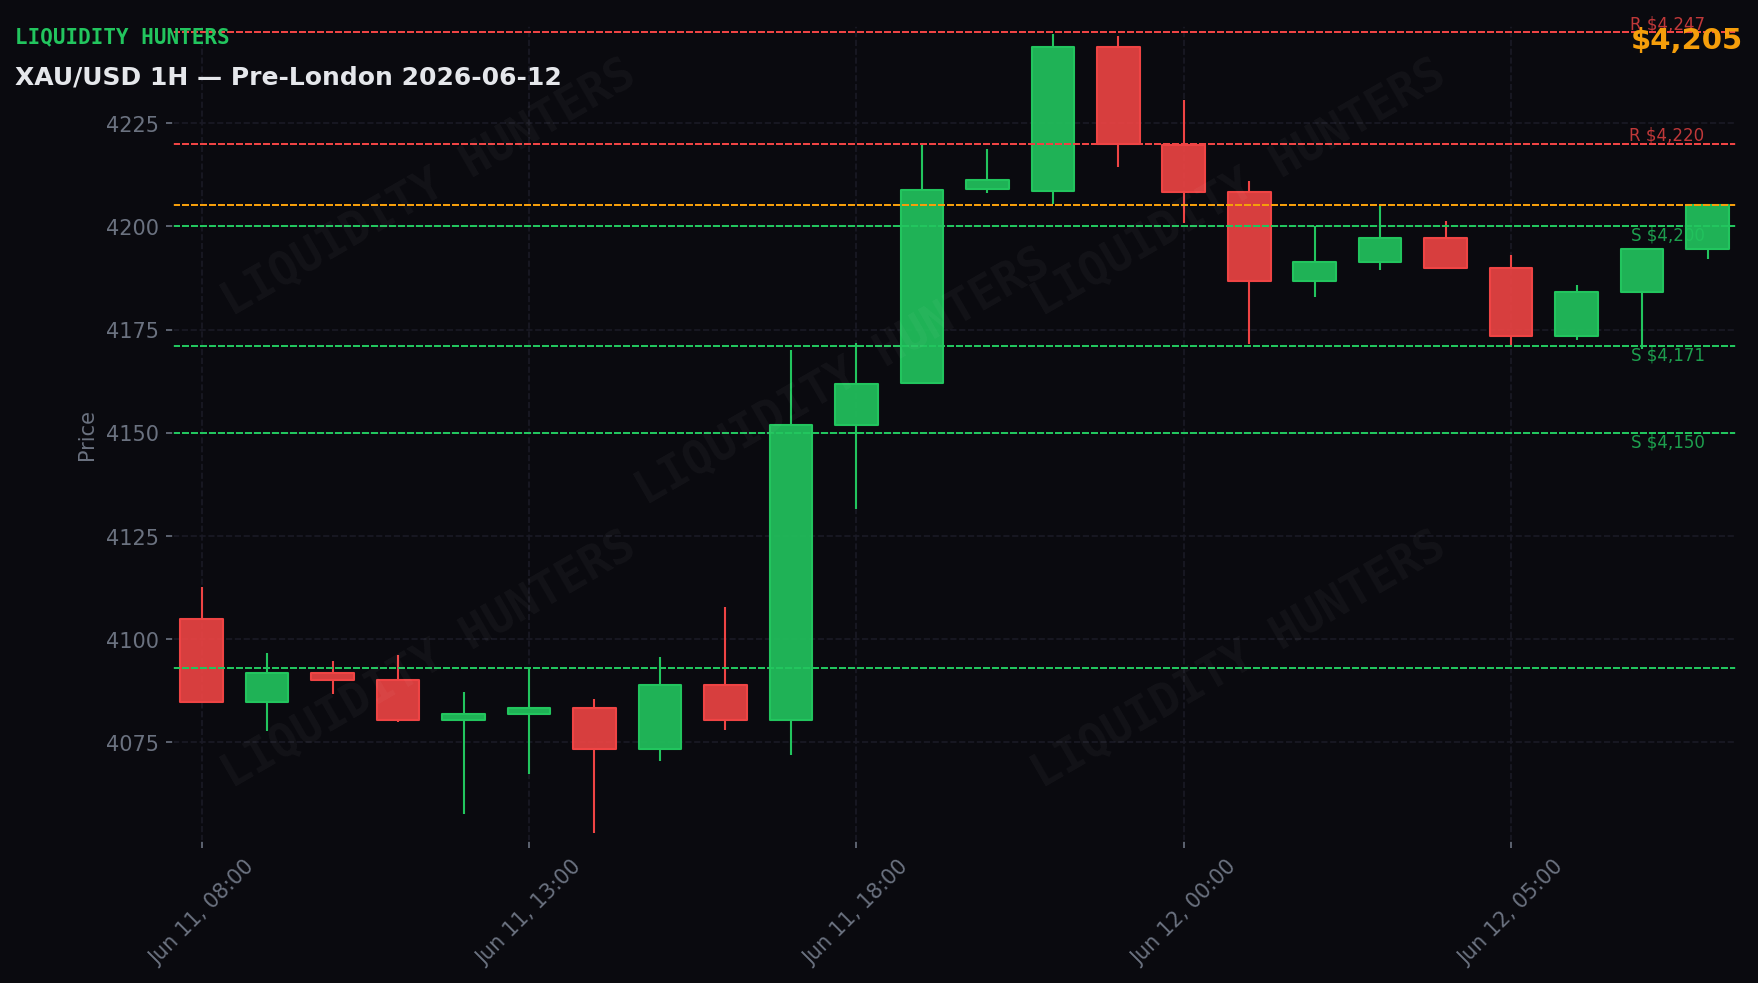
The immediate resistance is at $4,220. Key support is $4,200. Upper resistance extends toward $4,300. Deeper liquidity pool near $4,093. Watch for reactions at each level for SMC/ICT confirmations.
What is the main long setup for XAU/USD during the Pre-London killzone?
Main setup: LONG — Resistance breakout. Entry $4,220, SL $4,200, TP1 $4,247 (1:1.4). Trigger: Breakout + retest of $4,220. Custom sizing by account size is in the premium plan.
Where is the invalidation level for today's XAU/USD bias?
The neutral bias is invalidated with a clean 1H close above $4,300 or below $4,093. Until then, trade with the structure. Avoid counter-trend entries without a CHoCH confirmation on M15 or higher.
What macro drivers are affecting XAU/USD today?
**DXY neutral (+0.13%)** — no direct significant pressure. **Silver +4.2% — VERY POSITIVE.** The 0.95+ correlation between Gold and Silver is the highest of all assets. When Silver leads with this magnitude, Gold follows. Historically, Silver moves first at inflection points.
In summary
Gold fell 0.1% and closed at $4,205. It was a moderately active day — price moved $76 between its low ($4,170) and high ($4,247).
The market is indecisive (score -1). Price is trading in a range without clear direction. Better to wait for definition.
Why? Silver rose 4.2% (when silver rallies hard, gold tends to follow).
Premium content
Want the exact entry setups?
Subscribers receive, before each session, the exact entry and exit levels, institutional liquidity map and macro event alerts. You arrive at the market with a plan.
Technical analysis
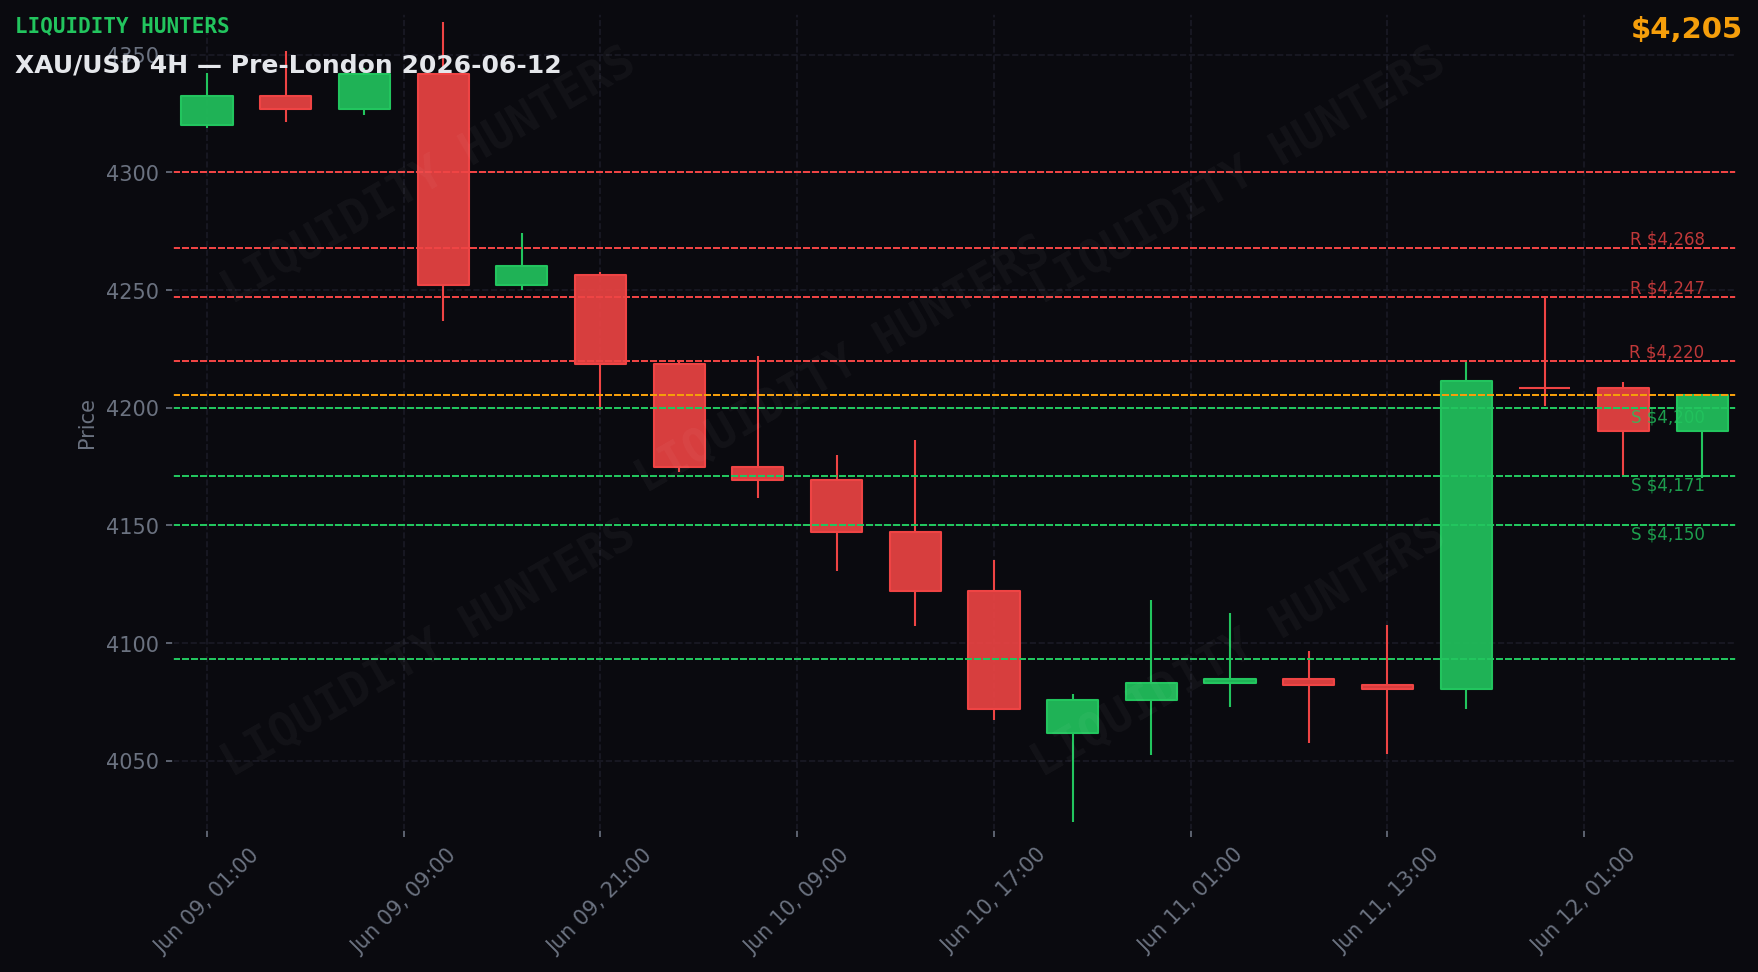
Gold closed Friday, June 12 at $4,205 (down 0.14%). 4H structure: BEARISH. Wyckoff Ranging. Daily range: $76 ($4,170 - $4,247). Score: -1 Neutral.
The day in detail
Act 1 — Asia (21:00-04:00 Chile): Downside pressure. Gold fell $36 from $4,220 to $4,184. Range of $60 with low at $4,171. The 01:00 UTC candle was the largest (range of $40).
Act 2 — London (04:00-09:00 Chile): Gold rose $21 (0.5%), from $4,184 to $4,205. Moderate range of $35.
Correlations
DXY neutral (+0.13%) — no direct significant pressure.
Silver +4.2% — VERY POSITIVE. The 0.95+ correlation between Gold and Silver is the highest of all assets. When Silver leads with this magnitude, Gold follows. Historically, Silver moves first at inflection points.
Market Maker
BSL (short stops above): $4,247, $4,246, $4,231 SSL (long stops below): $4,170, $4,171, $4,172
Price near SSL $4,200. The MM could sweep stops below and bounce. Likely bearish trap.
Trade setups
2 active setups. Entries, stops and targets below — all public. One trade; the favorite is marked. No trigger, no trade.
A. 🟢 LONG — Resistance breakout ⭐ Favorite
Entry: $4,220 · SL: $4,200 · TP1: $4,247 · R:R 1:1.4 · Risk: 0.5-0.75%
Trigger: Breakout + retest of $4,220
Confirmations (all mandatory):
- 1H candle closes ABOVE $4,220 (real close, not a wick)
- Retest: price returns to $4,220±5 and bounces (1-3 five-minute candles)
- On retest: 5m candle with lower wick touches $4,220 and close holds above
- Breakout volume > average (breakout candle must not be a doji or inside bar)
- Price does NOT return below $4,220 with a 5m close after retest
Invalid if:
- 1H close returns below $4,220 → false breakout, cancel
- 5m close below $4,200 → setup dead
- If no retest within 3 one-hour candles after breakout → expired, do not chase
B. 🔴 SHORT — Support breakdown
Entry: $4,200 · SL: $4,230 · TP1: $4,171 · R:R 1:1.0 · Risk: 0.5-0.75%
Trigger: Breakdown + retest of $4,200
Confirmations (all mandatory):
- 1H candle closes BELOW $4,200 (real close, not a wick)
- Retest: price returns to $4,200±5 and is rejected (1-3 five-minute candles)
- On retest: 5m candle with upper wick touches $4,200 and close holds below
- Breakdown volume > average (break candle with body >60%)
- Price does NOT return above $4,200 with a 5m close after retest
Invalid if:
- 1H close returns above $4,200 → false breakdown, cancel
- 5m close above $4,230 → setup dead
- If no retest within 3 one-hour candles after breakdown → expired, do not chase
Scenarios
Scenario 1 — Upside breakout (40%): Gold breaks the nearest resistance and continues. Bias turns bullish.
Scenario 2 — Range (40%): Gold trades between the support zone and nearest resistance. Trade the extremes.
Scenario 3 — Downside breakdown (20%): Gold breaks below the support zone. Downside continuation.
What to do
2 active setups — review the Trade setups section above for complete entries, stops, targets and triggers. Favorite: LONG Resistance breakout at $4,220.
The market is in a range between $4,200 and $4,220. Trade the extremes with confirmation. Wait for a clean breakout to define the bias.
Analysis generated by the Liquidity Hunters team. This is educational content and not financial advice. Trading involves risk of capital loss.
Disclaimer
Educational and informational content. This is not financial advice or a buy/sell recommendation. Trading involves risk of capital loss. Past results do not guarantee future results. Do your own research (DYOR).