XAU/USD SMC/ICT Analysis — April 2026 | Pre-Asia Killzone
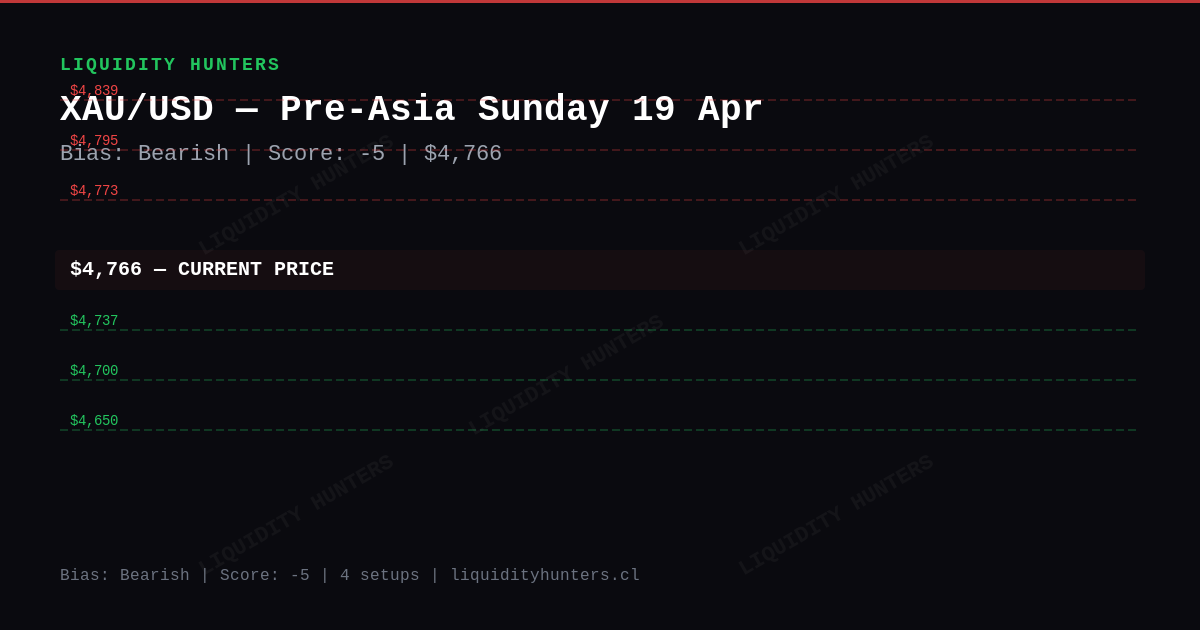
Key levels: R $4,773 / S $4,737. XAU/USD SMC/ICT analysis for the Pre-Asia session (April 19). Bias Bearish, score -5, 4 active setups.
Frequently Asked Questions
What is the XAU/USD bias for the Pre-Asia session today?
XAU/USD shows a bearish bias with score -5/10. Wyckoff phase is transition. Trade with the structural direction. Current price sits at $4,766.
What are the key resistance and support levels for XAU/USD today?
Immediate resistance sits at $4,773. Key support is $4,737. Higher resistance extends toward $4,871. Deeper liquidity pool near $4,600. Watch for reaction at each level for SMC/ICT confirmations.
What is the main XAU/USD short setup for the Pre-Asia killzone?
Main setup: SHORT with entry at $4,795, stop loss at $4,825, first take profit at $4,750. Trigger: Bearish rejection at $4,795. Always confirm on M5/M15 before executing.
Where is the invalidation level for today's XAU/USD bias?
The bearish bias invalidates on a clean 1H close above $4,871 or below $4,600. Until then, trade with the structure. Avoid counter-trend entries without a CHoCH confirmation on M15 or higher.
What macro drivers are affecting XAU/USD today?
**DXY neutral (+0.05%)** — no significant direct pressure. **Silver -2.8%** — negative. Broad weakness in precious metals.
In summary
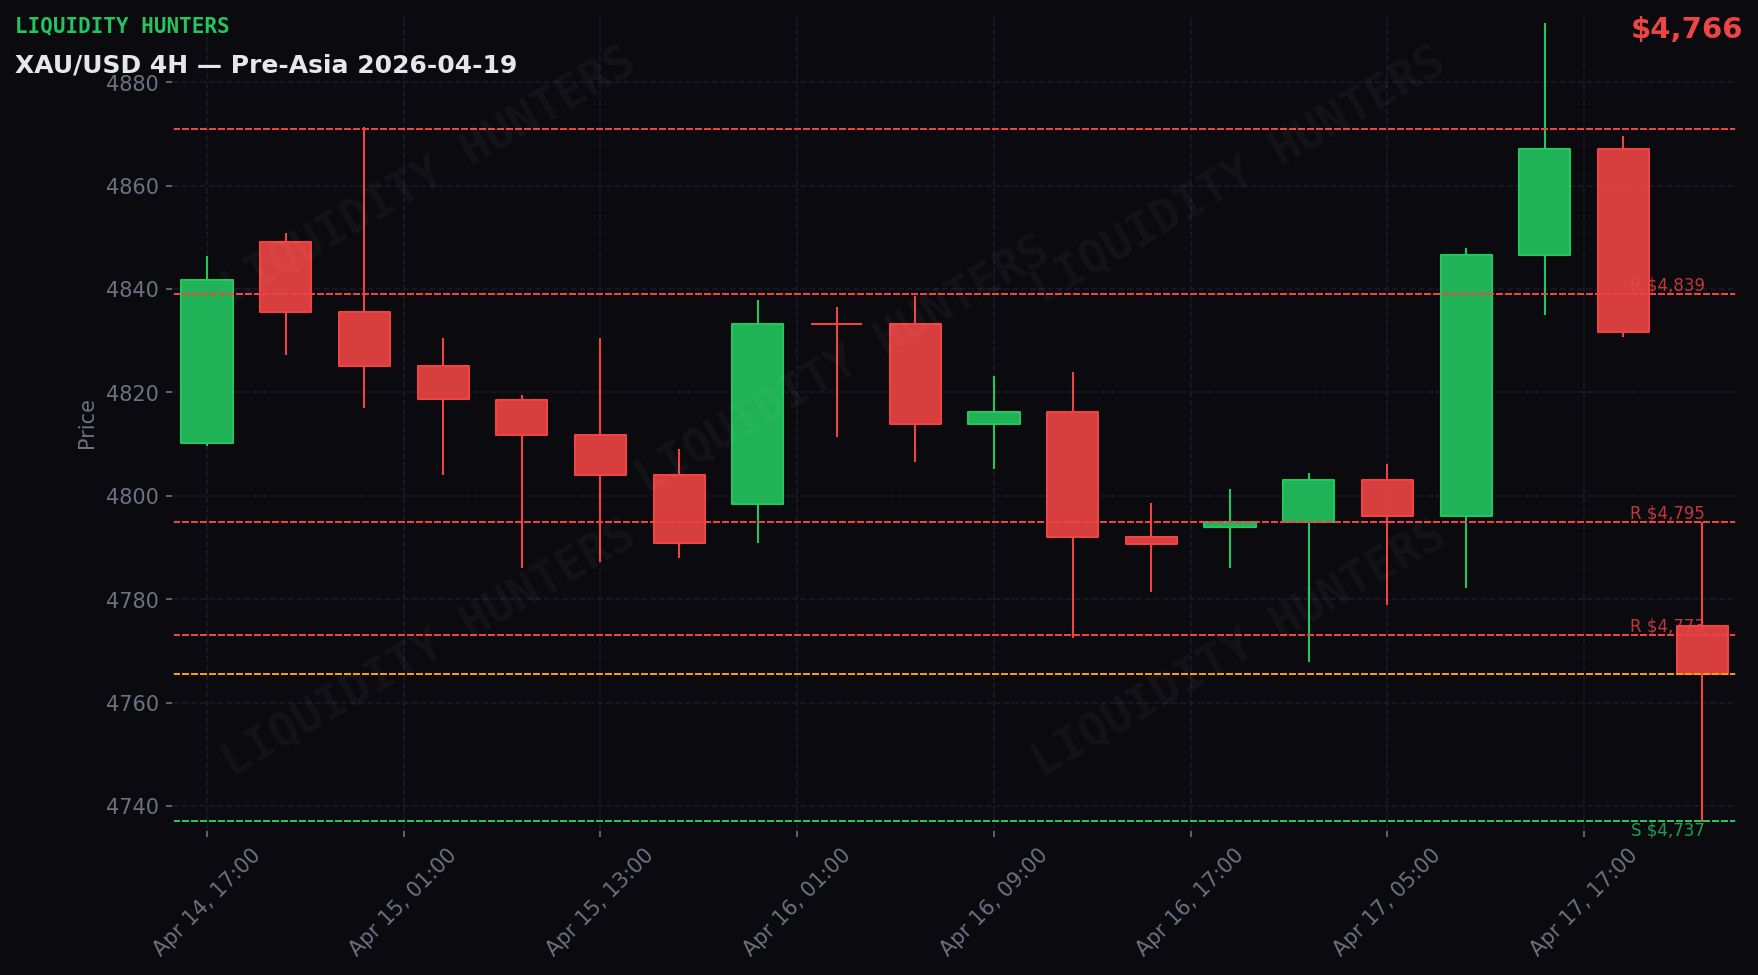
Gold fell 1.4% and closed at $4,766. It was a very active day — price swung $155 between its low ($4,737) and high ($4,892).
The trend is bearish (high conviction, score -5). Sellers are in control. If resistance isn’t reclaimed, more downside is likely.
Why? bond yields are rising (bad for gold); silver dropped 2.8% (a sign of weakness across metals).
Premium content
Want the exact entry setups?
Subscribers receive, before each session, the exact entry and exit levels, institutional liquidity map, and macro event alerts. You reach the market with a plan.
Technical analysis
Gold closed Sunday April 19 at $4,766 (fell 1.37%). 4H structure: BEARISH. Wyckoff Ranging. Daily range: $155 ($4,737 - $4,892). Score: -5 Bearish.

The day in detail
Act 1 — Asia (21:00-04:00 Chile): Bearish pressure. Gold dropped $26 from $4,792 to $4,766. Range of $62 with low at $4,745. The 01:00 UTC candle was the largest ($28 range).
Act 2 — London (04:00-09:00 Chile): Gold rose $34 (0.7%), from $4,766 to $4,799. Moderate range of $33.
Act 3 — NY (09:00-16:00 Chile): Strong move to the upside. Gold rose $59 from $4,799 to $4,858. Range of $94 with high at $4,892. The 13:00 UTC candle was the largest ($57 range).
Act 4 — Close (16:00-21:00 Chile): Bearish pressure. Gold dropped $103 from $4,858 to $4,755. Range of $58 with low at $4,737. The 23:00 UTC candle was the largest ($43 range).
Correlations
DXY neutral (+0.05%) — no significant direct pressure.
Silver -2.8% — negative. Broad weakness in precious metals.
Market Maker
Institutions are distributing on the rallies. Upside breakouts are potential traps.
Full Market Maker reading (BSL/SSL, institutional play and scenarios) in the premium plan.
Scenarios
Scenario 1 — Retest of resistance and rejection (50%): Gold rallies to nearest resistance and gets rejected. Sellers defend resistance. Bearish continuation toward support zone.
Scenario 2 — Range consolidation (30%): Gold stays between support zone-nearest resistance without direction. Wait for a catalyst.
Scenario 3 — Upside breakout (20%): Gold breaks nearest resistance with a 1H close above. Bias changes. Cancel shorts.
What to do
4 active setups. Favorite: SHORT Pullback to resistance. Exact entry, SL and TP in the premium plan.
Key resistance is the level to watch. Rejection = bearish continuation. Break on a 1H close = cancel shorts. Exact levels in the premium plan.
Analysis generated by the Liquidity Hunters team. This is educational content and not financial advice. Trading involves risk of capital loss.
Pre-session reports with entry setups
Before every session you get the likely setups with exact entry, SL and TP, correlations with DXY, Oil and Yields, macro news of the day, and a liquidity map. You reach the market with a plan.
Disclaimer
Educational and informational content. This is not financial advice or a buy/sell recommendation. Trading involves risk of capital loss. Past results do not guarantee future results. Do your own research (DYOR).