XAU/USD Analysis April 5: Bearish Structure at $4,634 + Active Setups
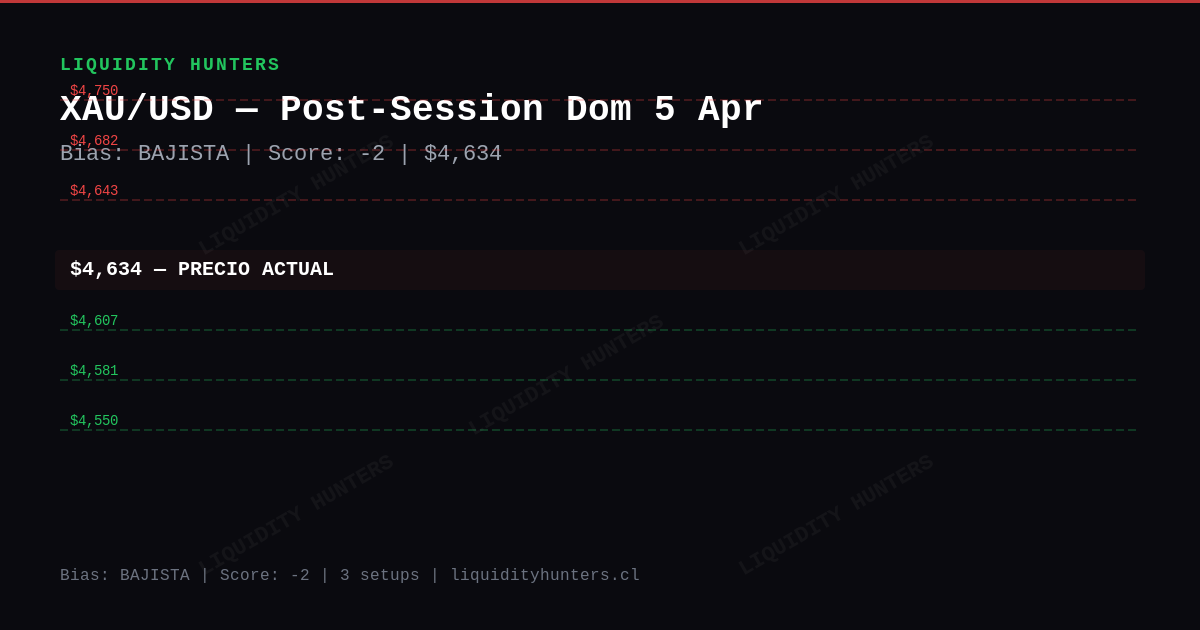
XAU/USD at $4,634 with bearish bias (score -2). 4H Structure, Wyckoff transition and 3 setups. April 8 CPI generates volatility. Key levels inside.
In summary
Gold fell 0.9% and closed at $4,634. It was a very volatile day — the price moved $119 between its low ($4,581) and high ($4,700).
The trend points downward (score -2). If the price recovers to resistance, it could reverse.
Next important event: Consumer Price Index (CPI) (2026-04-08 09:30 Chile). Could generate volatility.
Technical analysis
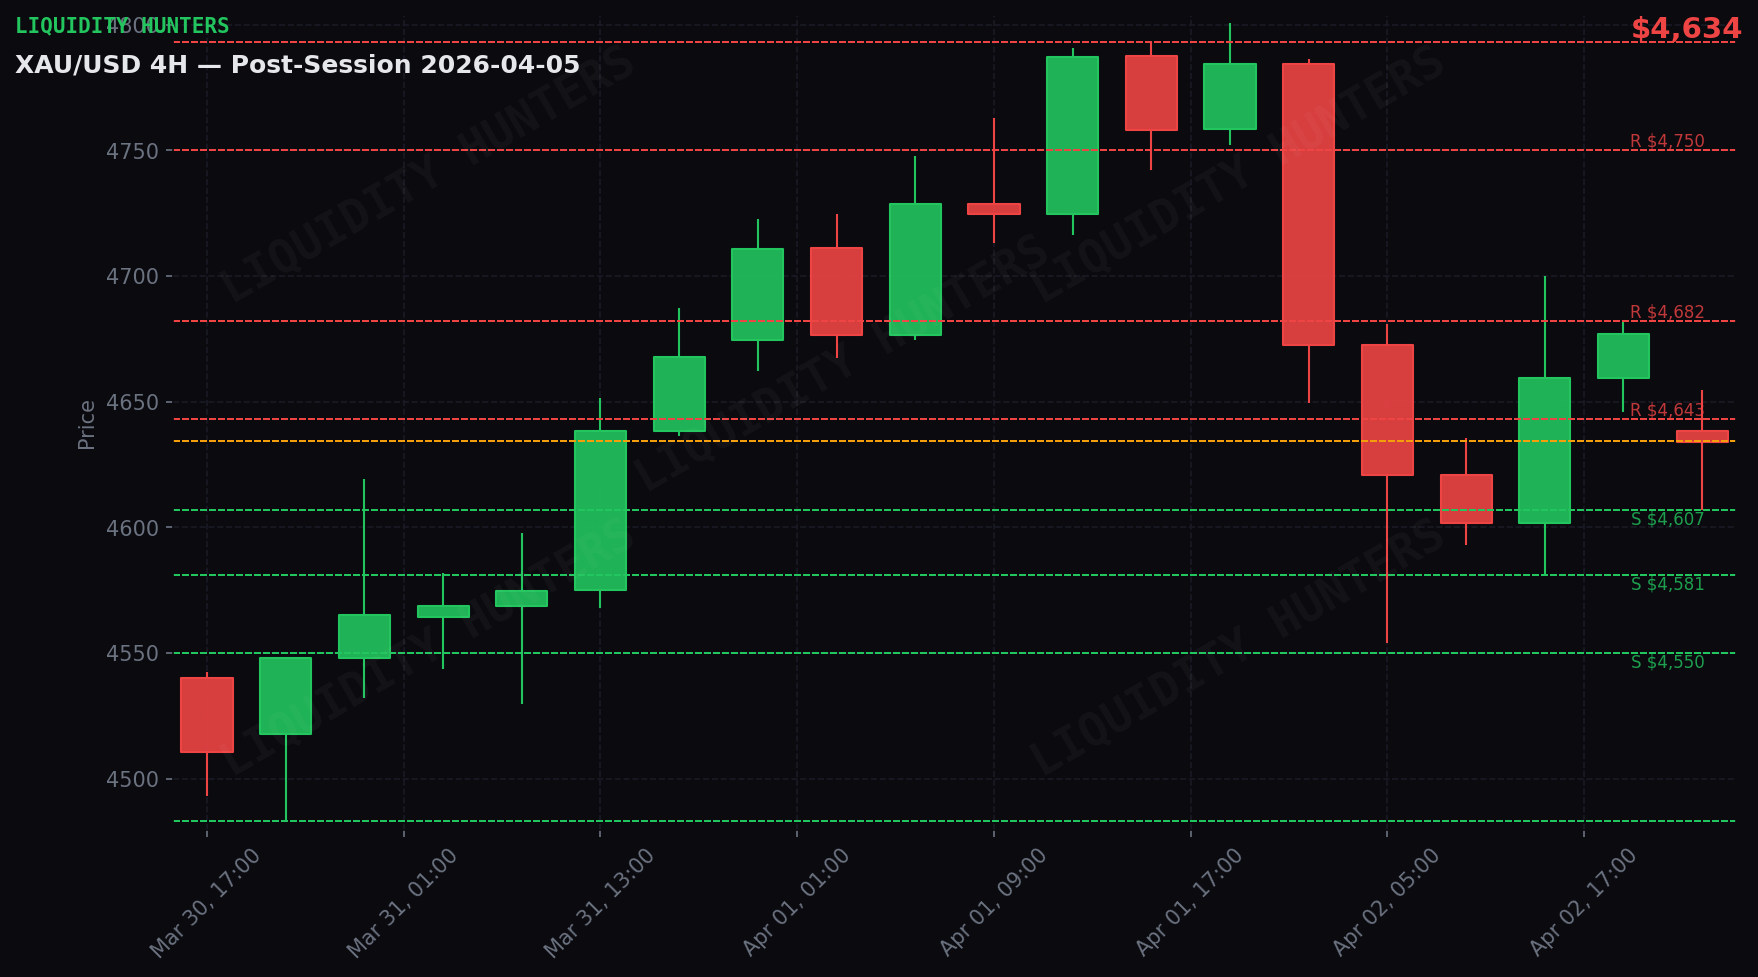
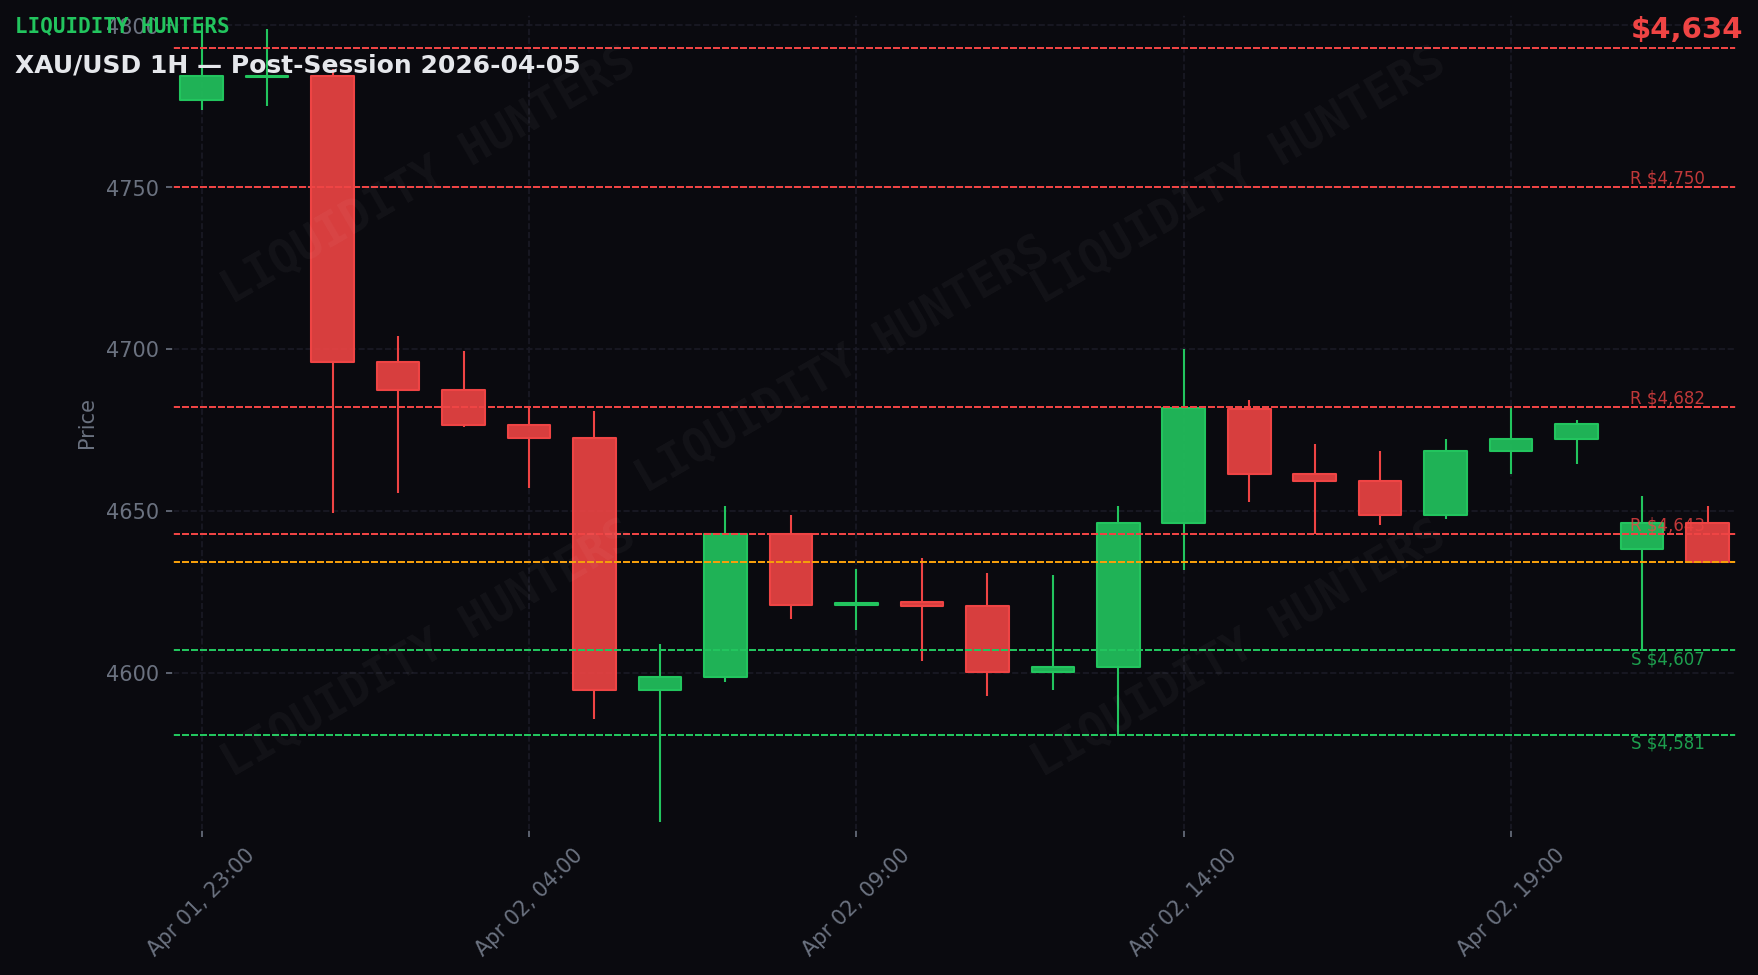
Gold closed on Sun April 5 at $4,634 (down 0.91%). Structure 4H: BEARISH. Wyckoff Ranging. Daily range: $119 ($4,581 - $4,700). Score: -2 BEARISH.
Day breakdown
Act 1 — Asia (21:00-04:00 Chile): Selling pressure. Gold dropped $185 from $4,784 to $4,599. Range of $119 with low at $4,581. The 01:00 UTC candle was the largest ($137 range).
Act 2 — London (04:00-09:00 Chile): Strong upward move. Gold rose $1 from $4,599 to $4,600. Range of $59 with high at $4,652. The 07:00 UTC candle was the largest ($54 range).
Act 3 — NY (09:00-16:00 Chile): Strong upward move. Gold rose $68 from $4,600 to $4,669. Range of $119 with high at $4,700. The 13:00 UTC candle was the largest ($71 range).
Act 4 — Close (16:00-21:00 Chile): Gold fell $34 (0.7%), from $4,669 to $4,634. Moderate range of $48.
Volatility HIGH
Daily ATR $204 vs normal $145 (1.4x). Movements are faster and liquidity sweeps are more aggressive. SL adjusted x1.5, risk reduced.
Correlations
DXY neutral (+0.03%) — no significant direct pressure.
Smart Money Concepts
Institutions are distributing on rallies. Upside breakouts are potential traps.
Trade setups
2 active setups. Entries, stops and targets below — all public. No trigger, no trade.
A. 🔴 SHORT — Retracement to resistance ⭐ Favorite
Entry: $4,750 · SL: $4,795 · TP1: $4,682 · R:R 1:1.5 · Risk: 0.67%
Trigger: Bearish rejection at $4,750
Confirmations (all required):
- Price rises to $4,750±5 zone (don’t short on the way down)
- Bearish CHoCH on 5m: lower low breaks last swing low
- 5m rejection candle: upper wick >60% of total range (pin bar or shooting star)
- Bearish displacement: red candle with body >70%, close in lower third
- The $4,750 resistance was NOT broken with 5m close above
Invalid if:
- 5m close above $4,780 → setup dead
- 1H close above $4,750 → resistance broken, cancel short
- If 2 hours pass without trigger → expired
B. 🔴 SHORT — Support breakdown
Entry: $4,662 · SL: $4,707 · TP1: $4,594 · R:R 1:1.5 · Risk: 0.5%
Trigger: Breakdown + retest of $4,662
Confirmations (all required):
- 1H candle closes BELOW $4,662 (actual close, not wick)
- Retest: price returns to $4,662±5 and is rejected (1-3 5m candles)
- On the retest: 5m candle with upper wick touches $4,662 and close remains below
- Breakdown volume > average (breakdown candle with body >60%)
- Price does NOT return above $4,662 with 5m close after the retest
Invalid if:
- 1H close back above $4,662 → false breakdown, cancel
- 5m close above $4,692 → setup dead
- If no retest in 3 1H candles post-breakdown → expired, don’t chase
Scenarios
Scenario 1 — Retracement to resistance and rejection (50%): Gold rises to the next resistance level and is rejected. Sellers defend resistance. Continuation lower toward the support zone.
Scenario 2 — Range consolidation (30%): Gold consolidates between the next support and resistance zones with no directional bias. Wait for a catalyst.
Scenario 3 — Upside breakout (20%): Gold breaks above the next resistance with a 1H close above. Bias changes. Cancel shorts.
What to do
3 active setups. Favorite: SHORT Retracement to resistance.
Key resistance is the level to watch. If rejected,
Disclaimer
Educational and informational content. This is not financial advice or a buy/sell recommendation. Trading involves risk of capital loss. Past results do not guarantee future results. Do your own research (DYOR).