XAU/USD Analysis Pre-NY March 31 - Gold at $4,617, Bullish Bias
XAU/USD at $4,617. 4H Structure Bullish. Wyckoff transition. 1 active setup. Score +8.

Summary
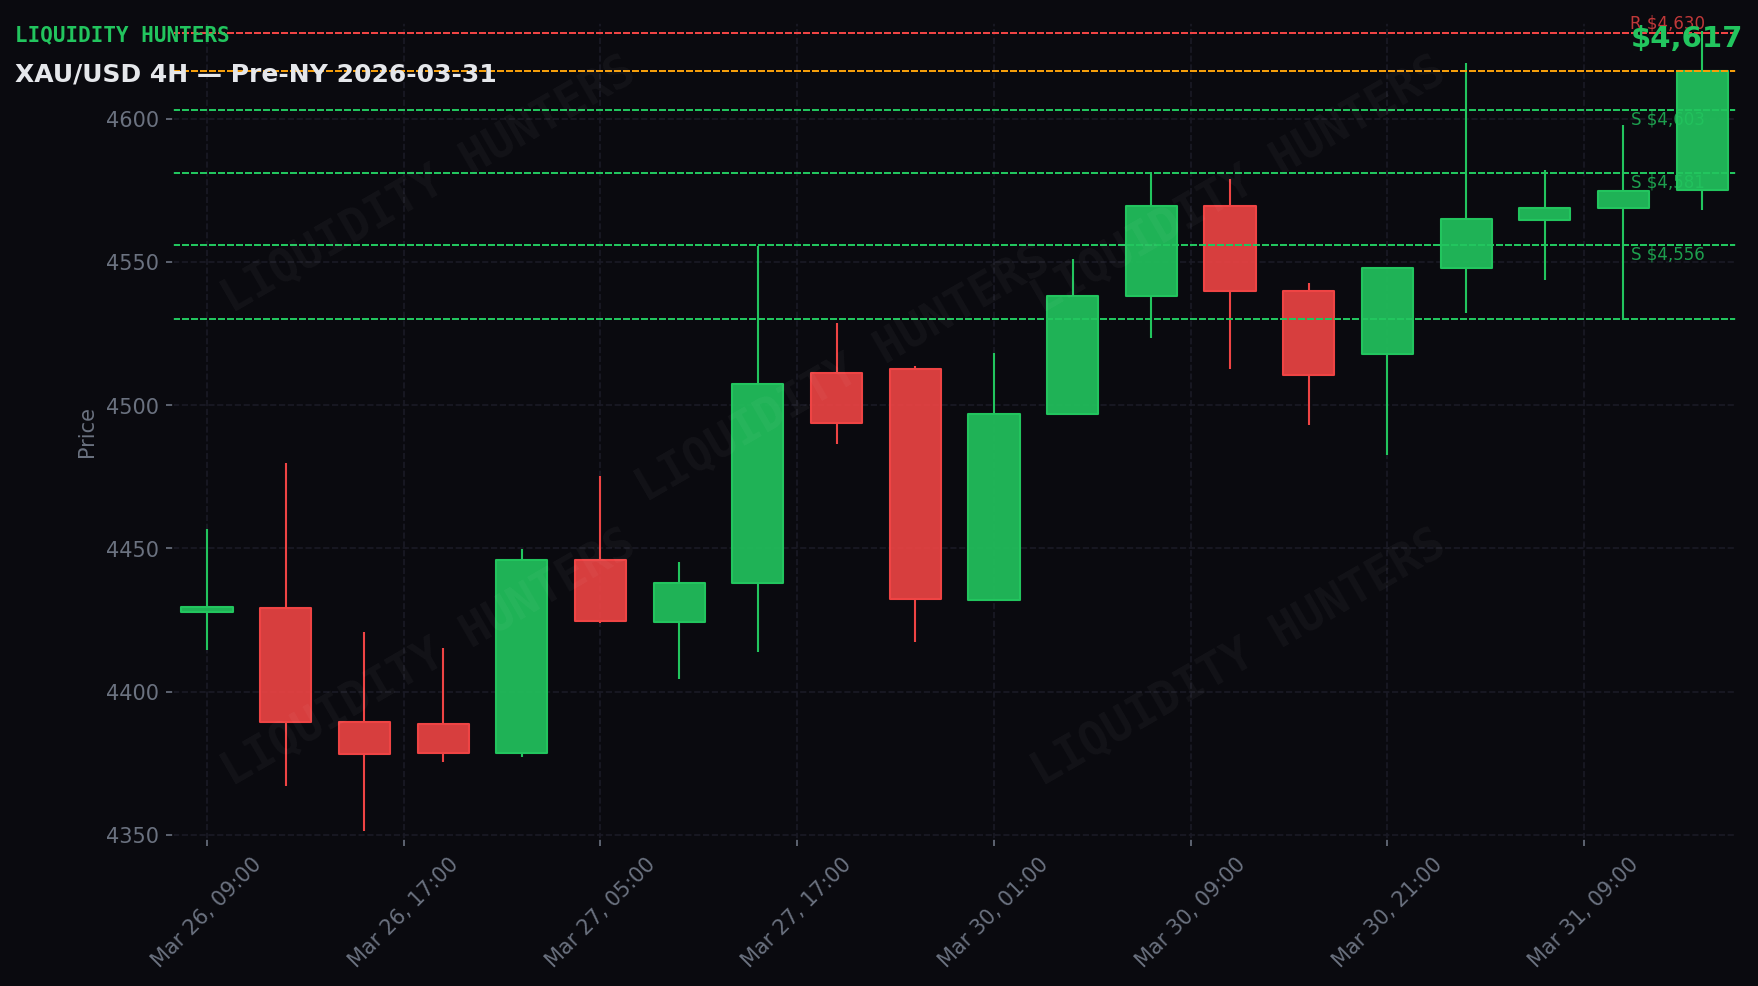
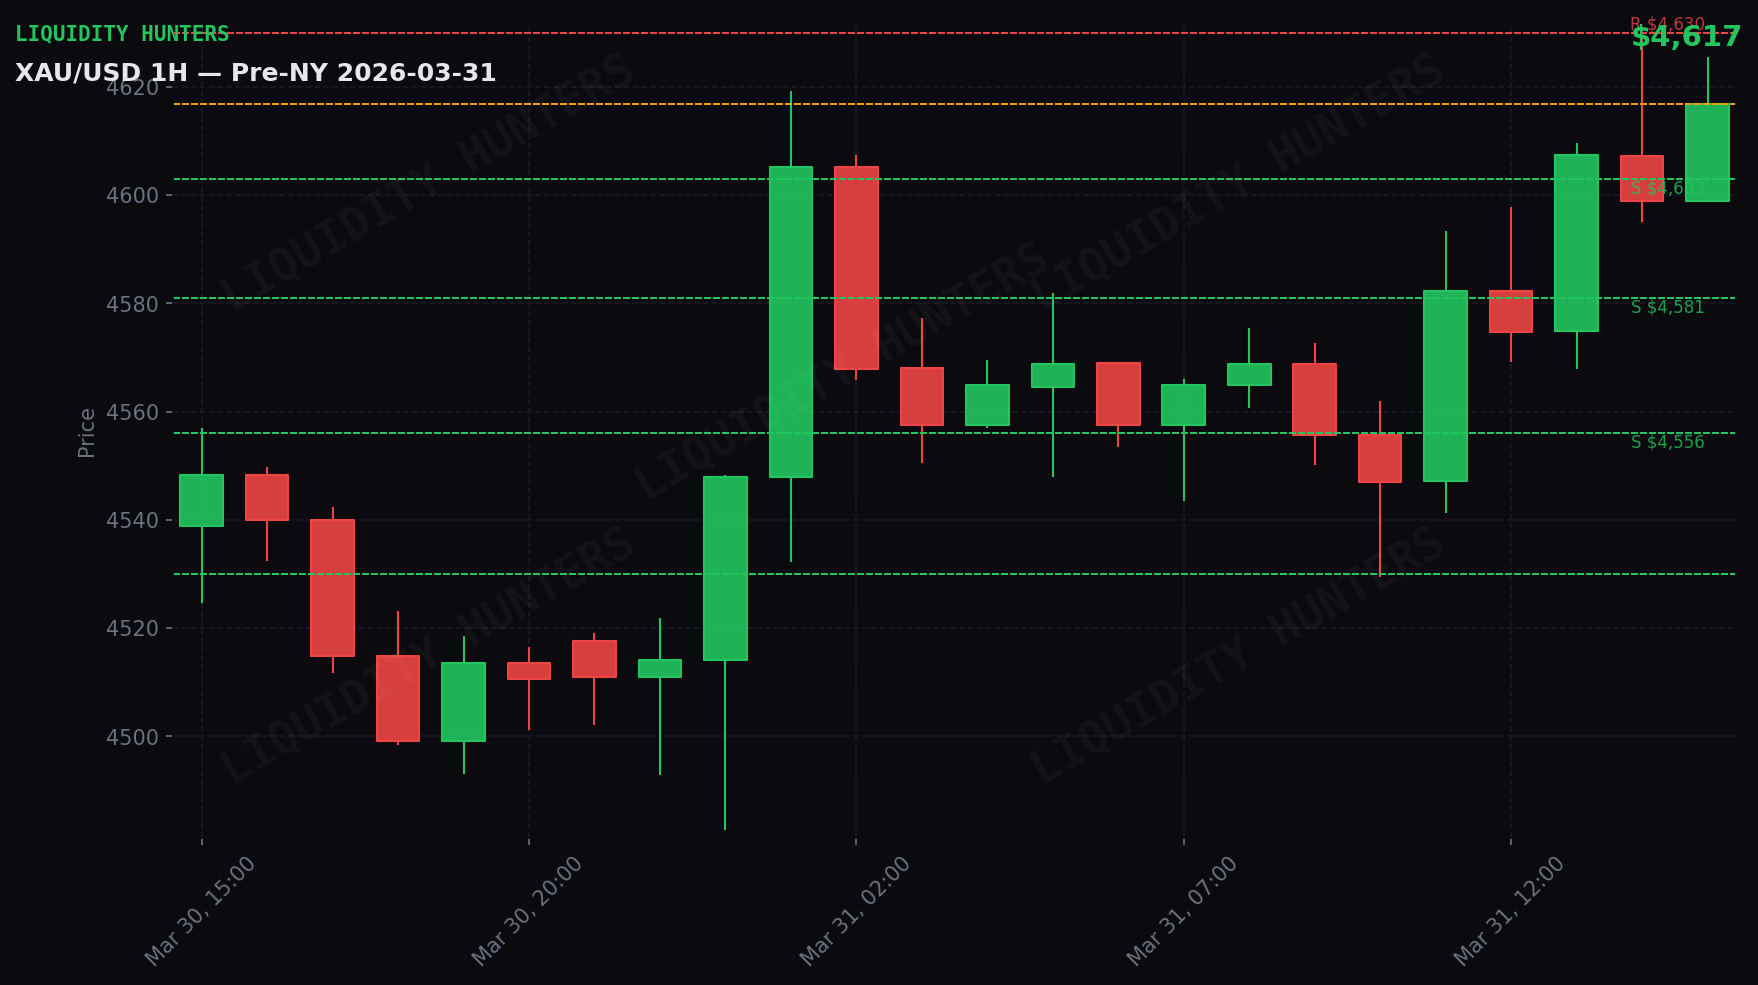
Gold rose 2.4% and closed at $4,617. It was a volatile day — price moved $101 between its low ($4,530) and high ($4,630).
The trend is bullish (high confidence, score +8). Large institutions are buying on pullbacks. If price holds above key support, it’s likely to rise in the coming sessions.
Why? bond yields are falling (good for gold, because gold competes with bonds); silver rose 5.4% (when silver rises strongly, gold tends to follow); the dollar is weakening (positive for gold).
Key data: U.S. employment report (2026-04-03 09:30 Chile). Strong data strengthens the dollar and pressures gold.
Premium Content
Want the exact entry setups?
Subscribers receive before each session: exact entry and exit points, institutional liquidity map, and macro event alerts. You arrive at the market with a plan.
Technical Analysis
Gold closed on March 31 at $4,617 (up 2.35%). Structure 4H: BULLISH. Wyckoff Ranging. Daily range: $101 ($4,530 - $4,630). Score: +8 BULLISH.
The Day in Detail
Act 1 — Asia (21:00-04:00 Chile): Strong upward move. Gold rose $43 from $4,514 to $4,558. Range of $90 with high at $4,619. The candle at 01:00 UTC candle was the largest ($87 range).
Act 2 — London (04:00-09:00 Chile): Strong upward move. Gold rose $25 from $4,558 to $4,582. Range of $64 with high at $4,593. The candle at 11:00 UTC candle was the largest ($52 range). London was the motor of the day — main move.
Act 3 — NY (09:00-16:00 Chile): Strong upward move. Gold rose $34 from $4,582 to $4,617. Range of $62 with high at $4,630. The candle at 13:00 UTC candle was the largest ($42 range).
HIGH Volatility
Daily ATR $191 vs normal $141 (1.4x). Movements are faster and sweeps more aggressive. SL adjusted x1.25, risk reduced.
Correlations
DXY falling (-0.40%) — dollar weakness favors Gold. Inverse correlation active. As long as DXY continues to weaken, Gold has tailwinds.
Silver +5.4% — VERY POSITIVE. The 0.95+ correlation between Gold and Silver is the highest among all assets. When Silver leads with this magnitude, Gold follows. Historically, Silver moves first at inflection points.
Yields falling (-0.69%) — positive for Gold. Lower bond yields favor assets without yield like gold.
Market Maker
Institutions are accumulating on pullbacks. Liquidity sweeps are buying opportunities, not signs of weakness.
The complete Market Maker reading (BSL/SSL, institutional gameplay and scenarios) is available in the premium plan.
Scenarios
Scenario 1 — Healthy pullback and continuation (50%): Gold pulls back to support zone at $4,597 and rebounds. Buyers defend support. Continuation toward next resistance.
Scenario 2 — Range consolidation (30%): Gold stays between support-next resistance zone with no clear direction. Lower volume.
Scenario 3 — Support break (20%): Gold loses support zone with 1H close below. Return to $4,581. Cancel longs.
What to Do
1 active setup. Favorite: LONG Resistance Breakout. Entry, SL, and TP exact available in the premium plan.
The key support of the day is the defense line. If it holds, bullish continuation. If it breaks with 1H close, cancel longs. Exact levels in the premium plan.
Critical event: Non-Farm Payrolls (NFP) — 2026-04-03 09:30 Chile. Reduce exposure before the data.
Analysis generated by the Liquidity Hunters team. This analysis is educational and not financial advice. Trading carries the risk of capital loss.
Disclaimer
Educational and informational content. This is not financial advice or a buy/sell recommendation. Trading involves risk of capital loss. Past results do not guarantee future results. Do your own research (DYOR).