XAU/USD Analysis Pre-NY Friday April 3 - Gold at $4,677, Neutral Bias
XAU/USD at $4,677. 4H Structure ACCUMULATION. Wyckoff: transition. 2 active setups. Score +0.

In Summary
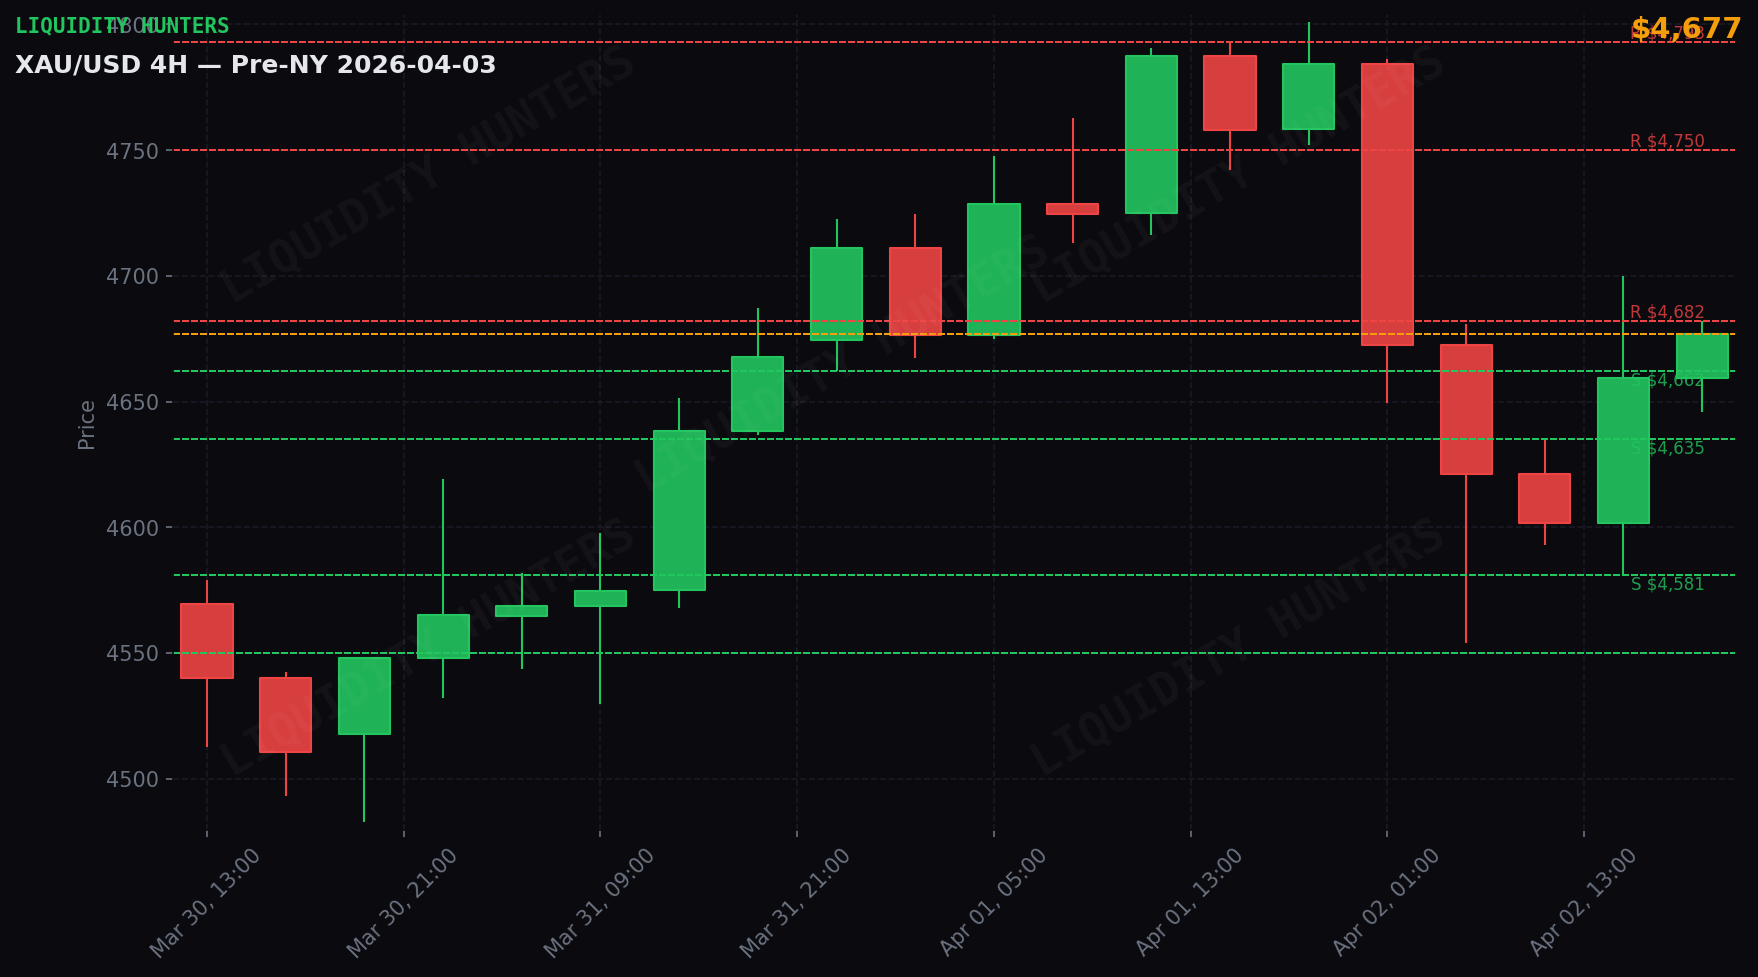
Gold fell 1.7% and closed at $4,677. It was a very volatile day — the price moved $119 between its lowest point ($4,581) and highest ($4,700).
The market is indecisive (score +0). Price oscillates in a range without a clear direction. Better to wait for it to define.
Why? Silver fell 4.1% (sign of weakness in metals).
Key point: US employment report (2026-04-03 09:30 Chile). A strong report strengthens the dollar and pressures gold.
Technical Analysis
Gold closed on Friday, April 3 at $4,677 (down 1.71%). Structure 4H: ACCUMULATION. Wyckoff Ranging. Daily range: $119 ($4,581 - $4,700). Score: +0 NEUTRAL.
The Day in Detail
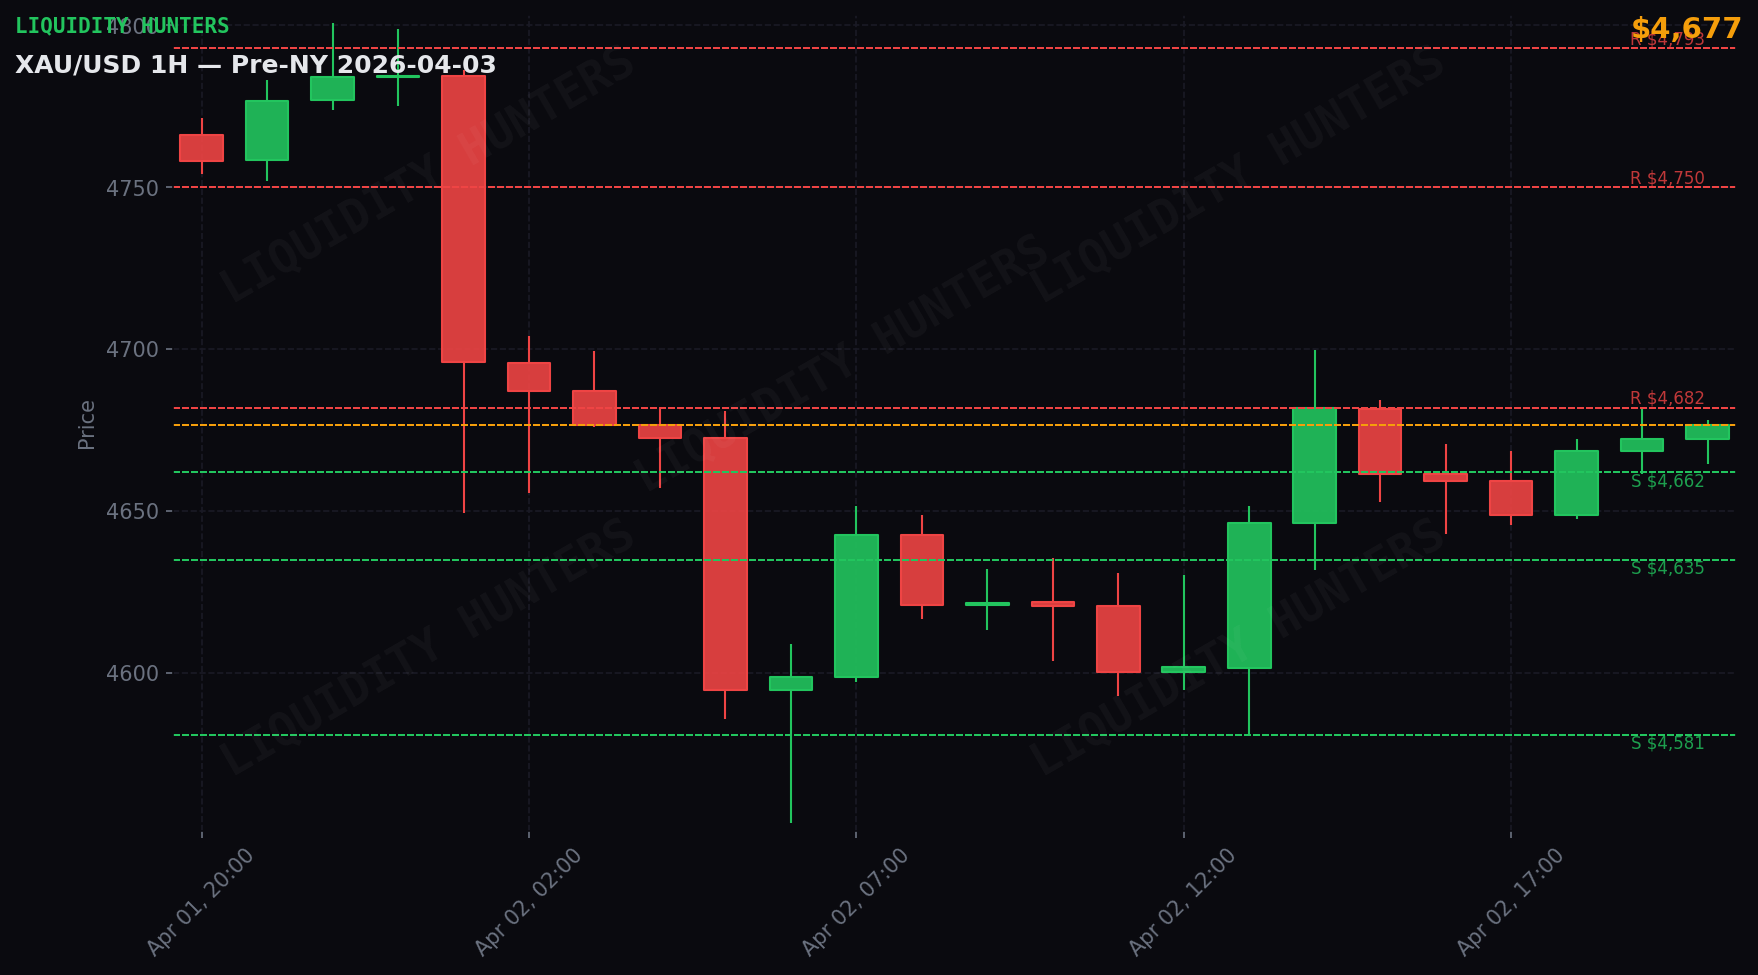
Act 1 — Asia (21:00-04:00 Chile): Downward pressure. Gold fell $185 from $4,784 to $4,599. Range of $119 with low at $4,581. The 01:00 UTC candle was the largest ($137 range).
Act 2 — London (04:00-09:00 Chile): Strong upward movement. Gold rose $1 from $4,599 to $4,600. Range of $59 with high at $4,652. The 07:00 UTC candle was the largest ($54 range).
Act 3 — NY (09:00-16:00 Chile): Strong upward movement. Gold rose $68 from $4,600 to $4,669. Range of $119 with high at $4,700. The 13:00 UTC candle was the largest ($71 range).
HIGH Volatility
Daily ATR $204 vs normal $144 (1.4x). Movements are faster and sweeps more aggressive. SL adjusted x1.5, reduced risk.
Correlations
DXY neutral (-0.05%) — without significant direct pressure.
Silver -4.1% — negative. Widespread weakness in precious metals.
Market Maker
Institutions are accumulating on pullbacks. Liquidity sweeps are buying opportunities, not signs of weakness.
Trade setups
2 active setups. Entries, stops and targets below — all public. No trigger, no trade.
A. 🔴 SHORT — Pullback to resistance ⭐ Favorite
Entry: $4,750 · SL: $4,795 · TP1: $4,618 · R:R 1:2.9 · Risk: 0.67%
Trigger: Bearish rejection at $4,750
Confirmations (all required):
- Price rises to $4,750±5 zone (don’t short on the way down)
- Bearish ChoCh on 5m: lower low breaks last swing low
- 5m rejection candle: upper wick >60% of total range (pin bar or shooting star)
- Bearish displacement: red candle with body >70%, close in lower third
- The $4,750 resistance was NOT broken with 5m close above
Invalid if:
- Close 5m above $4,780 → setup dead
- Close 1H above $4,750 → resistance broken, cancel short
- If 2 hours pass without trigger → expired
B. 🔴 SHORT — Support breakdown
Entry: $4,662 · SL: $4,707 · TP1: $4,622 · R:R 1:0.9 · Risk: 0.5%
Trigger: Breakdown + retest of $4,662
Confirmations (all required):
- 1H candle closes BELOW $4,662 (real close, not wick)
- Retest: price returns to $4,662±5 and is rejected (1-3 5m candles)
- On retest: 5m candle with upper wick touches $4,662 and close stays below
- Breakdown volume > average (break candle with body >60%)
- Price does NOT return above $4,662 with 5m close after retest
Invalid if:
- Close 1H back above $4,662 → false breakdown, cancel
- Close 5m above $4,692 → setup dead
- If no retest in 3 1H candles post-breakdown → expired, don’t chase
Scenarios
Scenario 1 — Upside Breakout (40%): Gold breaks nearby resistance and continues. Bias turns bullish.
Scenario 2 — Range (40%): Gold oscillates between support zone and nearby resistance. Trade range extremes.
Scenario 3 — Downside Breakout (20%): Gold loses support zone. Bearish continuation.
What to Do
2 active setups. Favorite: SHORT Pullback to Resistance.
The market is in a range. Trade extremes with confirmation. Wait for breakout to define bias.
Critical event: Non-Farm Payrolls (NFP) — 2026-04-03 09:30 Chile. Reduce exposure before the data.
Analysis generated by the Liquidity Hunters team. This analysis is educational and not financial advice. Trading carries the risk of capital loss.
Replay this day bar by bar in the simulator
Trade the same scenario risk-free: the replay starts on this date and the analysis levels activate on their own as you advance. When you close, the AI scores your decisions.
Open in the simulatorDisclaimer
Educational and informational content. This is not financial advice or a buy/sell recommendation. Trading involves risk of capital loss. Past results do not guarantee future results. Do your own research (DYOR).