XAU/USD Pre-Asia: Gold $4,812 SMC Analysis Wednesday Session
Gold at $4,812 with bullish structure on 4H. Score +7, 1 active setup. SMC/Wyckoff analysis and key levels. Read full analysis here.

Summary
Gold rose 2.3% and closed at $4,812. It was a very volatile day — the price moved $197 between its low ($4,661) and high ($4,858).
The trend is bullish (high confidence, score +7). Large institutions are buying on pullbacks. If the price holds above key support, further upside is likely in the coming sessions.
Why? Bond yields are falling (good for gold, as gold competes with bonds); silver rose 7.3% (when silver moves strongly, gold tends to follow); the dollar is weakening (positive for gold).
Next key event: Consumer Price Index (CPI) (2026-04-08 09:30 Chile). Could generate volatility.
Technical Analysis
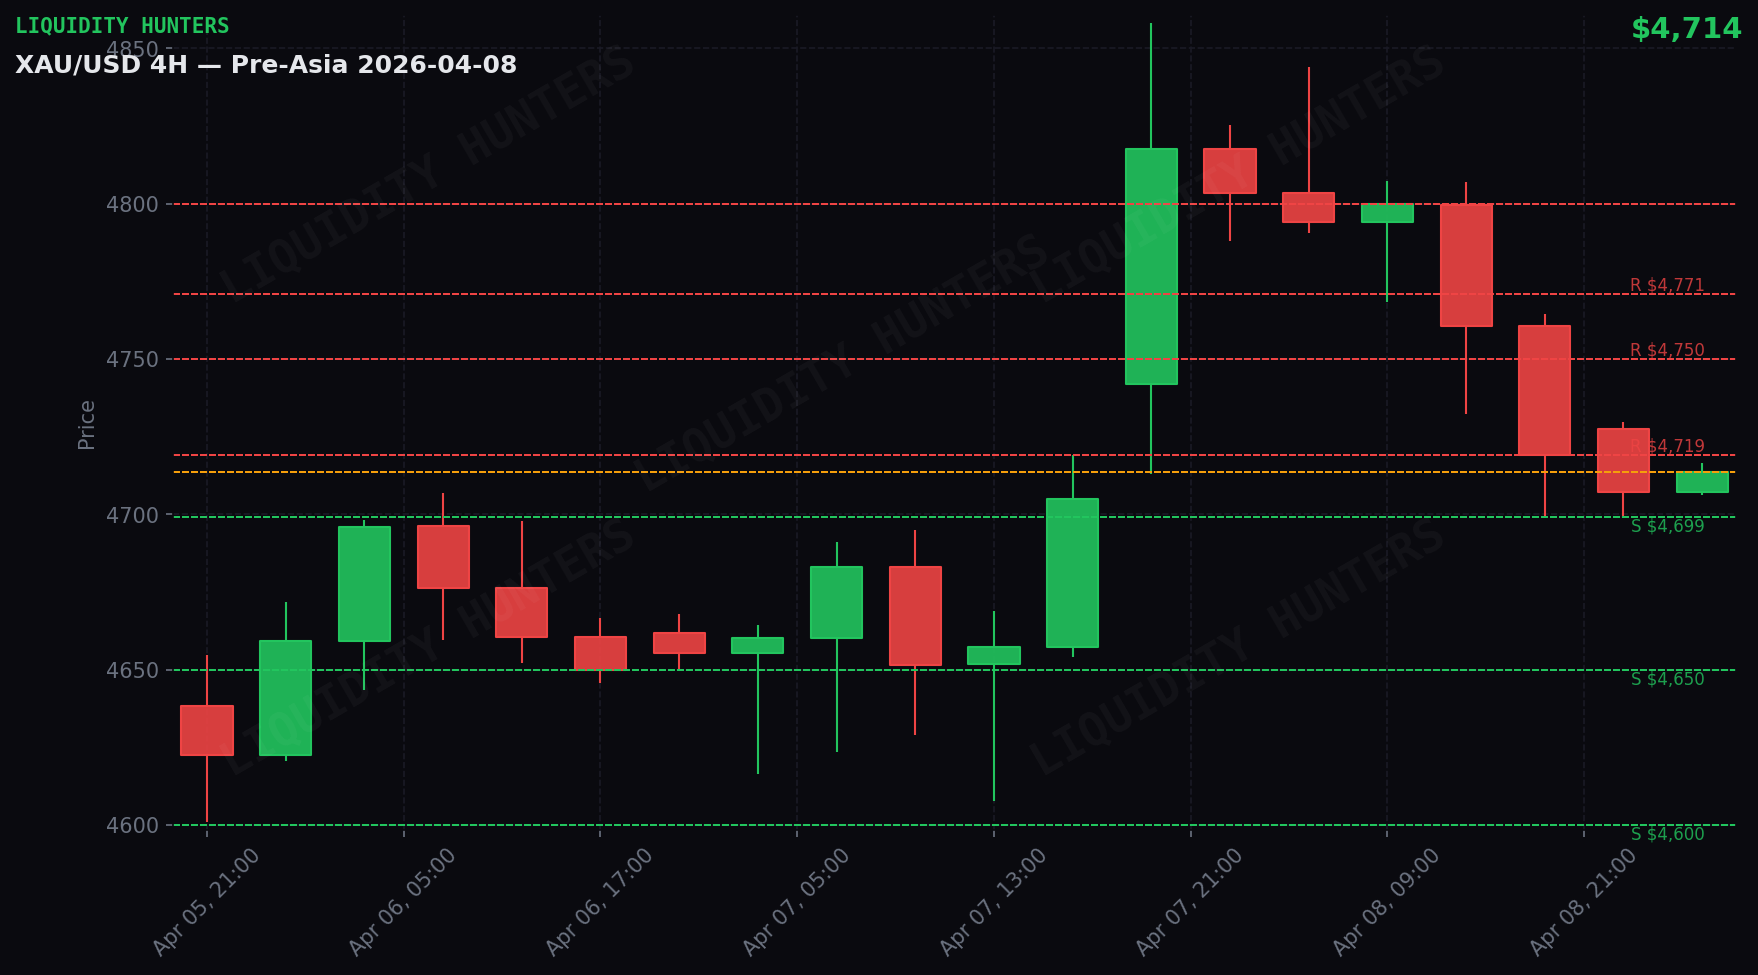
Gold closed on Wednesday, April 8 at $4,812 (up 2.28%). Structure 4H: BULLISH. Wyckoff Ranging. Daily range: $197 ($4,661 - $4,858). Score: +7 BULLISH.
Session Summary
A high-volatility day with a range of $197. The price oscillated between $4,661 and $4,858. The price closed near resistance at $4,825 — pushing higher.
HIGH Volatility
Daily ATR $205 vs. normal $146 (1.4x). Movements are faster and liquidity sweeps are more aggressive. SLs adjusted x1.5, reduced risk.
Correlations
DXY declining (-0.62%) — dollar weakness favors gold. Inverse correlation active. While DXY continues to weaken, gold has tailwinds.
Silver +7.3% — VERY POSITIVE. The 0.95+ correlation between gold and silver is the highest among all assets. When silver leads with this magnitude, gold follows. Historically, silver moves first at inflection points.
Yields declining (-1.16%) — positive for gold. Lower bond yields favor yield-free assets like gold.
Smart Money Concepts
Institutions are accumulating on pullbacks. Liquidity sweeps are buy opportunities, not signs of weakness.
Trade setups
1 active setup. Entries, stops and targets below — all public. No trigger, no trade.
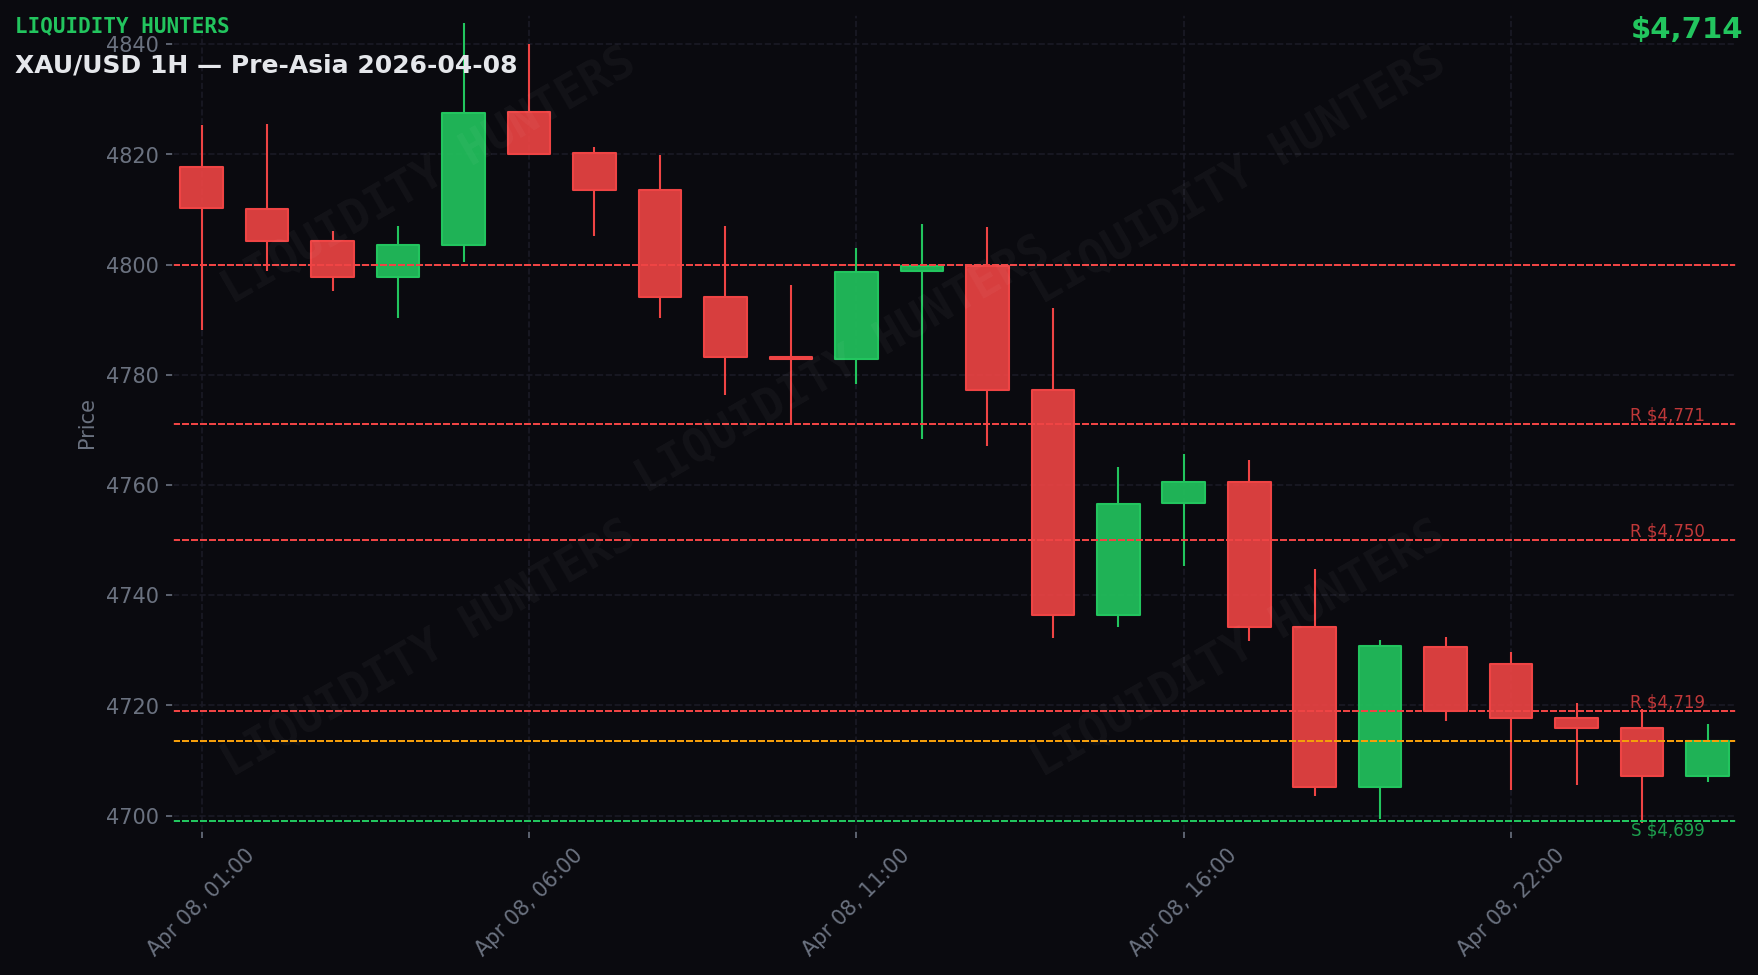
A. 🔴 SHORT — Support breakdown ⭐ Favorite
Entry: $4,788 · SL: $4,833 · TP1: $4,720 · R:R 1:1.5 · Risk: 0.33%
Trigger: Breakdown + retest of $4,788
Confirmations (all required):
- 1H candle closes BELOW $4,788 (real close, not wick)
- Retest: price returns to $4,788±5 and is rejected (1-3 candles 5m)
- On the retest: 5m candle with upper wick touches $4,788 and close stays below
- Breakdown volume > average (breakout candle with body >60%)
- Price does NOT return above $4,788 with 5m close after the retest
Invalid if:
- 1H close back above $4,788 → false breakdown, cancel
- 5m close above $4,818 → dead setup
- If no retest within 3 candles 1H post-breakdown → expired, do not pursue
Scenarios
Scenario 1 — Healthy pullback and continuation (50%): Gold retraces to the support zone at $4,792 and bounces. Buyers defend support. Continuation toward the next resistance.
Scenario 2 — Range consolidation (30%): Gold stays between the support-resistance zone with no clear direction. Volume drops.
Scenario 3 — Support breakdown (20%): Gold loses the support zone with a 1H close below. Pullback to $4,7
Replay this day bar by bar in the simulator
Trade the same scenario risk-free: the replay starts on this date and the analysis levels activate on their own as you advance. When you close, the AI scores your decisions.
Open in the simulatorDisclaimer
Educational and informational content. This is not financial advice or a buy/sell recommendation. Trading involves risk of capital loss. Past results do not guarantee future results. Do your own research (DYOR).