Break of Structure vs Change of Character: What's the Difference
BOS and CHoCH explained with real XAU/USD examples. How to identify them, when they appear, and why confusing them costs you gold trading setups. SMC/ICT guide.
The Most Common Confusion in SMC
If you’re studying Smart Money Concepts, sooner or later you’ll ask yourself: what’s the difference between BOS and CHoCH? Both are structural breaks. Both break a swing high or swing low. But they mean completely different things — and confusing them can cost you trades.
The short answer:
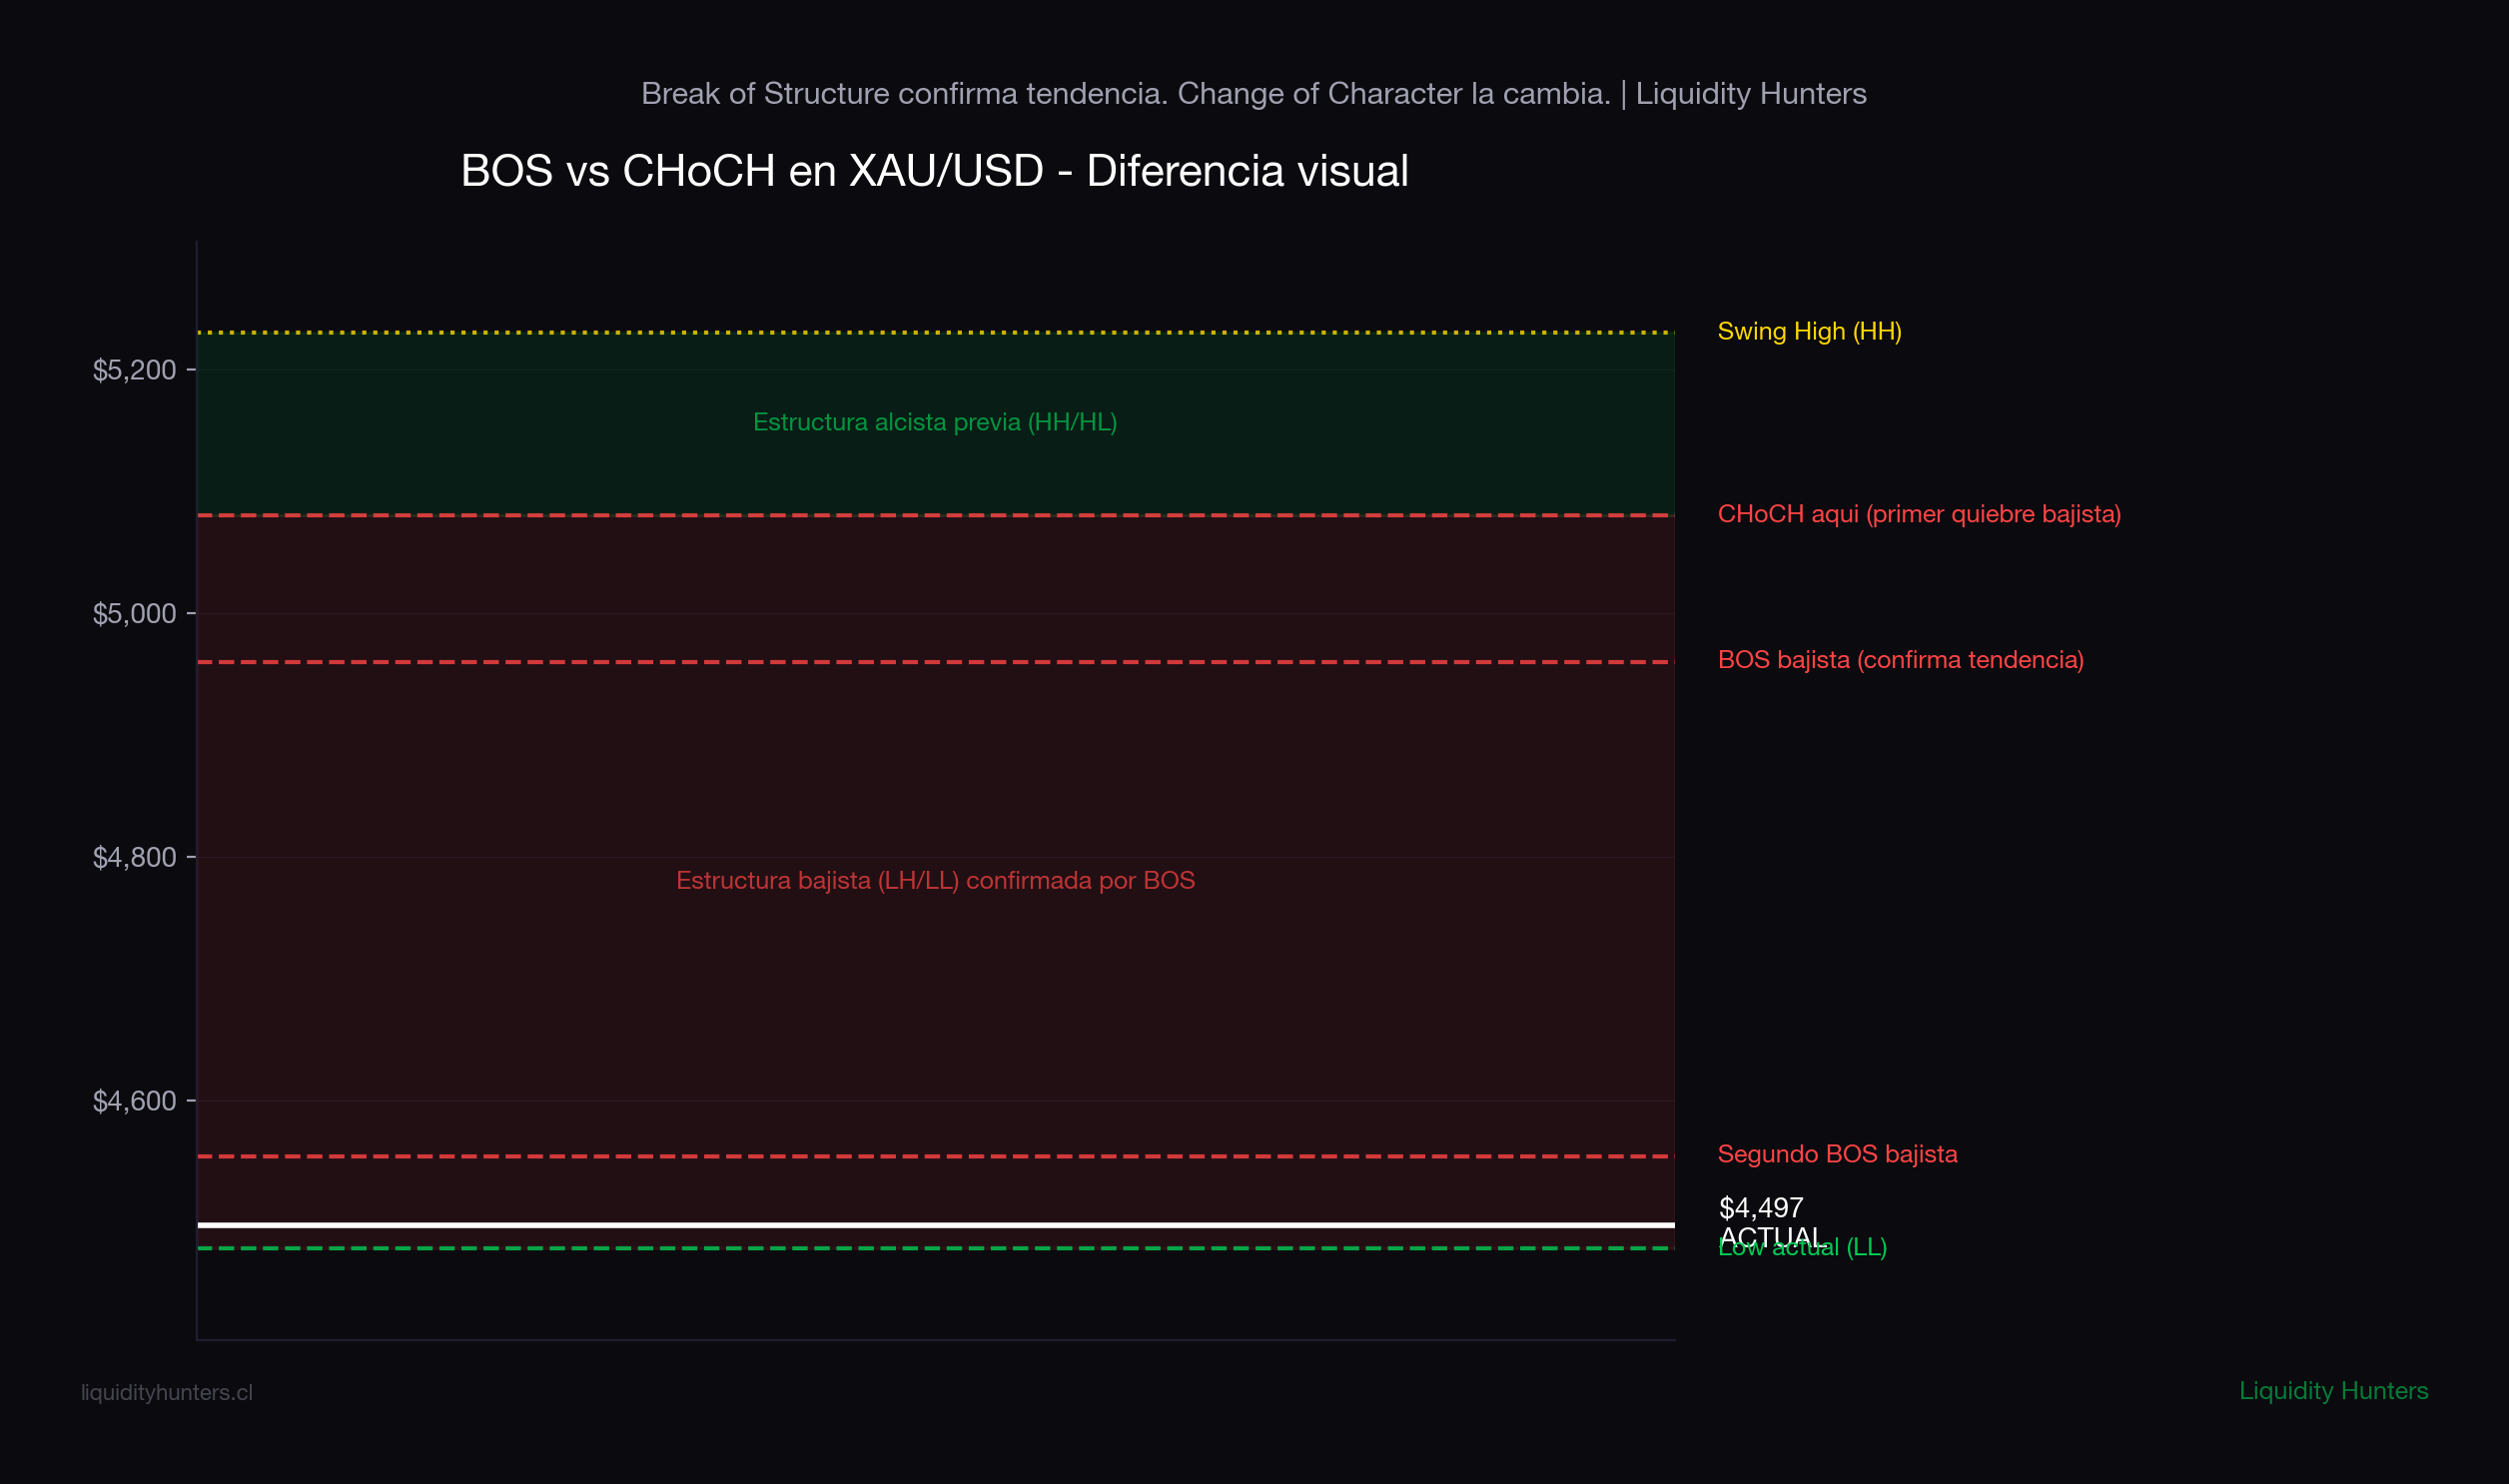
BOS = the market confirms the current trend continues. CHoCH = the market shifts direction. First sign of reversal.
Break of Structure (BOS)
A Break of Structure occurs when price breaks a swing high or swing low in the same direction as the trend. It’s a continuation confirmation.
Bullish BOS
Uptrend:

 HH <── price breaks this high = bullish BOS
 / \
 / \
HL HL- Price makes Higher Lows (HL) and Higher Highs (HH)
- When it breaks the last HH, that’s a bullish BOS
- It confirms: “the uptrend continues, buyers are still in control”
Bearish BOS
Downtrend:

LL LL
 \ /
 \ /
 LH
LL <── price breaks this low = bearish BOS- Price makes Lower Highs (LH) and Lower Lows (LL)
- When it breaks the last LL, that’s a bearish BOS
- It confirms: “the downtrend continues, sellers are still in control”
Real Example: Bearish BOS in Gold (March 2026)
On March 18, Gold broke the swing low at $4,960 which had been support for weeks. That was a clear bearish BOS:
- Price had been making Lower Highs ($5,400 → $5,230 → $5,001)
- The prior low was $4,960 (range support)
- When price closed below $4,960 with displacement, it confirmed the bearish trend was active
What to do after a BOS: look for a pullback to an Order Block or FVG in the direction of the trend. After the $4,960 BOS, the sell zone was $4,960-$4,996 (bearish OB = Breaker Block).
Change of Character (CHoCH)
A Change of Character occurs when price breaks a swing high or swing low in the opposite direction of the trend. It’s the first signal that the trend might be shifting.
Bearish CHoCH (from bullish to bearish)
Uptrend... until:

 HH
 / \
 / \
 HL \
LL <── price breaks this HL = bearish CHoCH- Price had been making HH/HL (bullish)
- Suddenly, it breaks a Higher Low — that shouldn’t happen in an uptrend
- That’s a bearish CHoCH: first sign that sellers have taken control
Bullish CHoCH (from bearish to bullish)
Downtrend... until:

 HH <── price breaks this LH = bullish CHoCH
 /
 /
LH /
 \ /
LL- Price had been making LH/LL (bearish)
- Suddenly, it breaks a Lower High — that shouldn’t happen in a downtrend
- That’s a bullish CHoCH: first sign that buyers have taken control
Real Example: Bearish CHoCH in Gold (March 2026)
On March 13, Gold broke the swing low at $5,080 after making a high at $5,230. That was the bearish CHoCH:
- Price was coming from an uptrend (rally from $4,400 to $5,400+)
- $5,080 was a prior Higher Low within the bullish structure
- When price closed below $5,080, it was the first signal the trend had changed
- 5 days later came the BOS at $4,960 confirming the bearish trend
The CHoCH is the alert. The BOS is the confirmation.
The Key Difference: A Table
| Aspect | BOS | CHoCH |
|---|---|---|
| What it breaks | Swing H/L in the direction of the trend | Swing H/L in the OPPOSITE direction |
| What it means | The trend continues | The trend might change |
| When it appears | Within an established trend | At the end of a trend, start of a new one |
| Reliability | High — confirms what we already know | Medium — it’s only the first signal, can fail |
| How to trade it | Look for entry in the direction of the BOS | Wait for confirmation (BOS in the new direction) |
| Risk | Lower — you’re trading with the trend | Higher — you’re trading against the prior trend |
| Frequency | Multiple per trend | Only once (marks the shift) |
The Complete Sequence: How They Connect
In practice, BOS and CHoCH form a sequence that tells you exactly where you are in the market:
PHASE 1: Uptrend
BOS up... BOS up... BOS up (successive confirmations)

PHASE 2: Shift
CHoCH down (first signal of change — ALERT)

PHASE 3: Confirmation
BOS down (confirms the new bearish trend)

PHASE 4: New downtrend
BOS down... BOS down... BOS down (successive confirmations)

PHASE 5: Another shift
CHoCH up (first signal of bullish change — ALERT)
... and the cycle repeats
The Real Sequence in Gold (January - March 2026)
| Date | Event | Price | Meaning |
|---|---|---|---|
| Jan-Feb | BOS up, BOS up, BOS up | $4,800 → $5,400 | Strong uptrend, multiple BOS |
| Mar 13 | CHoCH down | Breaks $5,080 | First bearish signal. Alert. |
| Mar 18 | BOS down | Breaks $4,960 | Confirmation. Bearish trend active. |
| Mar 19 | BOS down | Breaks $4,520 | Second BOS. Capitulation. |
| Mar 20 | Close | $4,497 | Bearish on all TFs. Waiting for CHoCH up. |
What we’re watching now: for Gold to turn bullish, we need a bullish CHoCH — price needs to break a recent Lower High. That LH is at ~$4,738 (Friday March 20 high). If price closes above $4,738 on 4H, that would be the first bullish CHoCH.
Common Mistakes
1. Confusing CHoCH with BOS
If the trend is bearish and price breaks a low — that’s a BOS (continuation), NOT a CHoCH. A CHoCH only occurs when the break is against the trend.
2. Trading the CHoCH as if it were confirmation
The CHoCH is an alert, not a confirmation. Many traders see a CHoCH and enter aggressively in the new direction. The problem: the CHoCH can fail. Wait for the BOS in the new direction to confirm.
3. Ignoring the timeframe
A CHoCH on the 5-minute chart doesn’t change the Daily trend. Always check the higher timeframe:
- CHoCH on 5m/15m: intraday structure change (for scalps)
- CHoCH on 1H/4H: swing structure change (for day trades)
- CHoCH on Daily: real trend change (for swing trades)
4. Not marking swing points correctly
BOS and CHoCH depend on correctly identifying swing highs and swing lows. If you mark the swings wrong, your entire structural analysis is invalid.
Simple rule: a swing high needs at least 1 lower candle on each side. A swing low needs at least 1 higher candle on each side. Use 3 candles on each side for greater precision.
5. Looking for CHoCH without context
A CHoCH is more valuable when it occurs:
- At an HTF Order Block zone
- After a liquidity sweep (stop hunt)
- With displacement (large-bodied candles)
Without these confluences, the CHoCH is weak and could be a trap.
How to Use BOS and CHoCH in Your Trading
If the trend is clear (multiple BOS):
- Identify the trend with BOS on 4H/Daily
- Wait for a pullback to an OB or FVG
- Look for BOS on LTF (15m/5m) as entry confirmation
- Enter in the direction of the trend
- SL behind the OB, TP at the next liquidity level
If you see a CHoCH:
- Don’t enter immediately — it’s only an alert
- Wait for price to pull back and form an OB/FVG in the new direction
- Look for BOS in the new direction (on the same TF or a lower one)
- Only then enter — now you have CHoCH + BOS = double confirmation
- SL behind the swing point of the CHoCH
Practical Example Right Now (Gold, March 22, 2026):
- Current structure: bearish (multiple bearish BOS on Daily)
- To sell: wait for pullback to $4,554 (ex-OB), look for bearish BOS on 15m
- To buy: we need a bullish CHoCH first (4H close above $4,738), then bullish BOS in the new direction. We’re not there yet.
Glossary of Terms Used
| Term | Definition |
|---|---|
| BOS (Break of Structure) | Break of a swing H/L in the direction of the trend. Confirms continuation. |
| CHoCH (Change of Character) | Break of a swing H/L against the trend. First signal of change. |
| Market Structure | Sequence of HH/HL (bullish) or LH/LL (bearish). BOS and CHoCH define it. |
| Order Block | Entry zone after a BOS or CHoCH. Where institutions have orders. |
| FVG (Fair Value Gap) | Imbalance that confirms the strength of a BOS/CHoCH. |
| Displacement | Impulsive move that accompanies a valid BOS or CHoCH. |
| Liquidity Sweep | Stop hunt that frequently precedes a CHoCH. |
| Breaker Block | OB invalidated by a CHoCH. Changes from support to resistance or vice versa. |
| Swing High / Swing Low | Local maximum or minimum. The foundation for identifying BOS and CHoCH. |
| HH/HL | Higher High / Higher Low — bullish structure. |
| LH/LL | Lower High / Lower Low — bearish structure. |
Disclaimer
Educational and informational content. This is not financial advice or a buy/sell recommendation. Trading involves risk of capital loss. Past results do not guarantee future results. Do your own research (DYOR).