Pre-London XAU/USD — Tuesday March 25, 2026: Triple Test of $4,310 and Institutional Absorption
XAUUSD forecast for London: gold price tested $4,310 three times without breaking on Monday. We analyze the structure, correlations, and what to expect for the London session.
Context: What Happened Monday
Gold opened the week with a bearish gap from $4,497 (Friday close) to $4,466 in Asia, and ended the day at $4,364. Monday’s range was $156 ($4,310 - $4,466) — more than double a normal day.
The most relevant thing about Monday wasn’t the drop, but what happened at $4,310.
The Triple Test of $4,310
The price visited the $4,310-$4,325 zone three times during the day:
| Test | Time (UTC) | Low | Bounce |
|---|---|---|---|
| 1 | 12:00 | $4,316 | +$55 |
| 2 | 13:00 | $4,310 | +$67 |
| 3 | 16:00 | $4,318 | +$51 |
Each test penetrated LESS and the recovery was FAST. This is a classic absorption pattern in Smart Money Concepts: there is an institutional participant accumulating position in that zone.
The 16:30 UTC candle was the most revealing: a spike of $44 in 15 minutes ($4,324 → $4,369). That type of movement is not generated by a retail trader — it’s institutional capital entering.
Current Structure
- Daily: Bearish. BOS confirmed. Sequence of lower highs / lower lows since $5,405. No change.
- 4H: Bearish. The 11:00 UTC candle with $107 range was displacement institutional to the downside.
- 1H: Bearish, but with signs of exhaustion. Each bearish impulse loses strength.
- 15m: Higher lows since $4,310: $4,310 → $4,326 → $4,318 → $4,324. Selling pressure is exhausting at this level.
Bias: Bearish in HTF, but with visible absorption at $4,310.
Wyckoff — ACCUMULATION Phase B (Secondary Test)
Gold’s behavior at $4,310 fits the Wyckoff accumulation methodology. Breakdown by phases:
| Phase | Event | Price | Detail |
|---|---|---|---|
| Phase A | Selling Climax (SC) | $4,310 | Drop of $156 on Monday. Climax volume. |
| Phase A | Automatic Rally (AR) | $4,377 | Rapid post-SC bounce. Defines temporary upper range. |
| Phase B | Secondary Test (ST) | $4,310-$4,318 | Triple test without breaking. Absorption confirmed. |
Interpretation
The triple test of $4,310 is a classic Secondary Test in Phase B. The characteristics:
- Declining volume on each test — Sellers are exhausting. Each penetration is smaller.
- Rapid recovery — Institutional capital absorbs the supply without letting price fall.
- Potential Spring — If $4,310 is briefly swept and recovers, it would be a Wyckoff Spring — the most powerful buy signal in the methodology.
Wyckoff accumulation range: $4,310 (support) — $4,466 (resistance).
The market needs to complete Phase B before a possible Sign of Strength (SOS). This implies that $4,310 may be tested ONE MORE TIME before the definitive upside move.
Key Levels for Today
The levels we are watching for the London session:
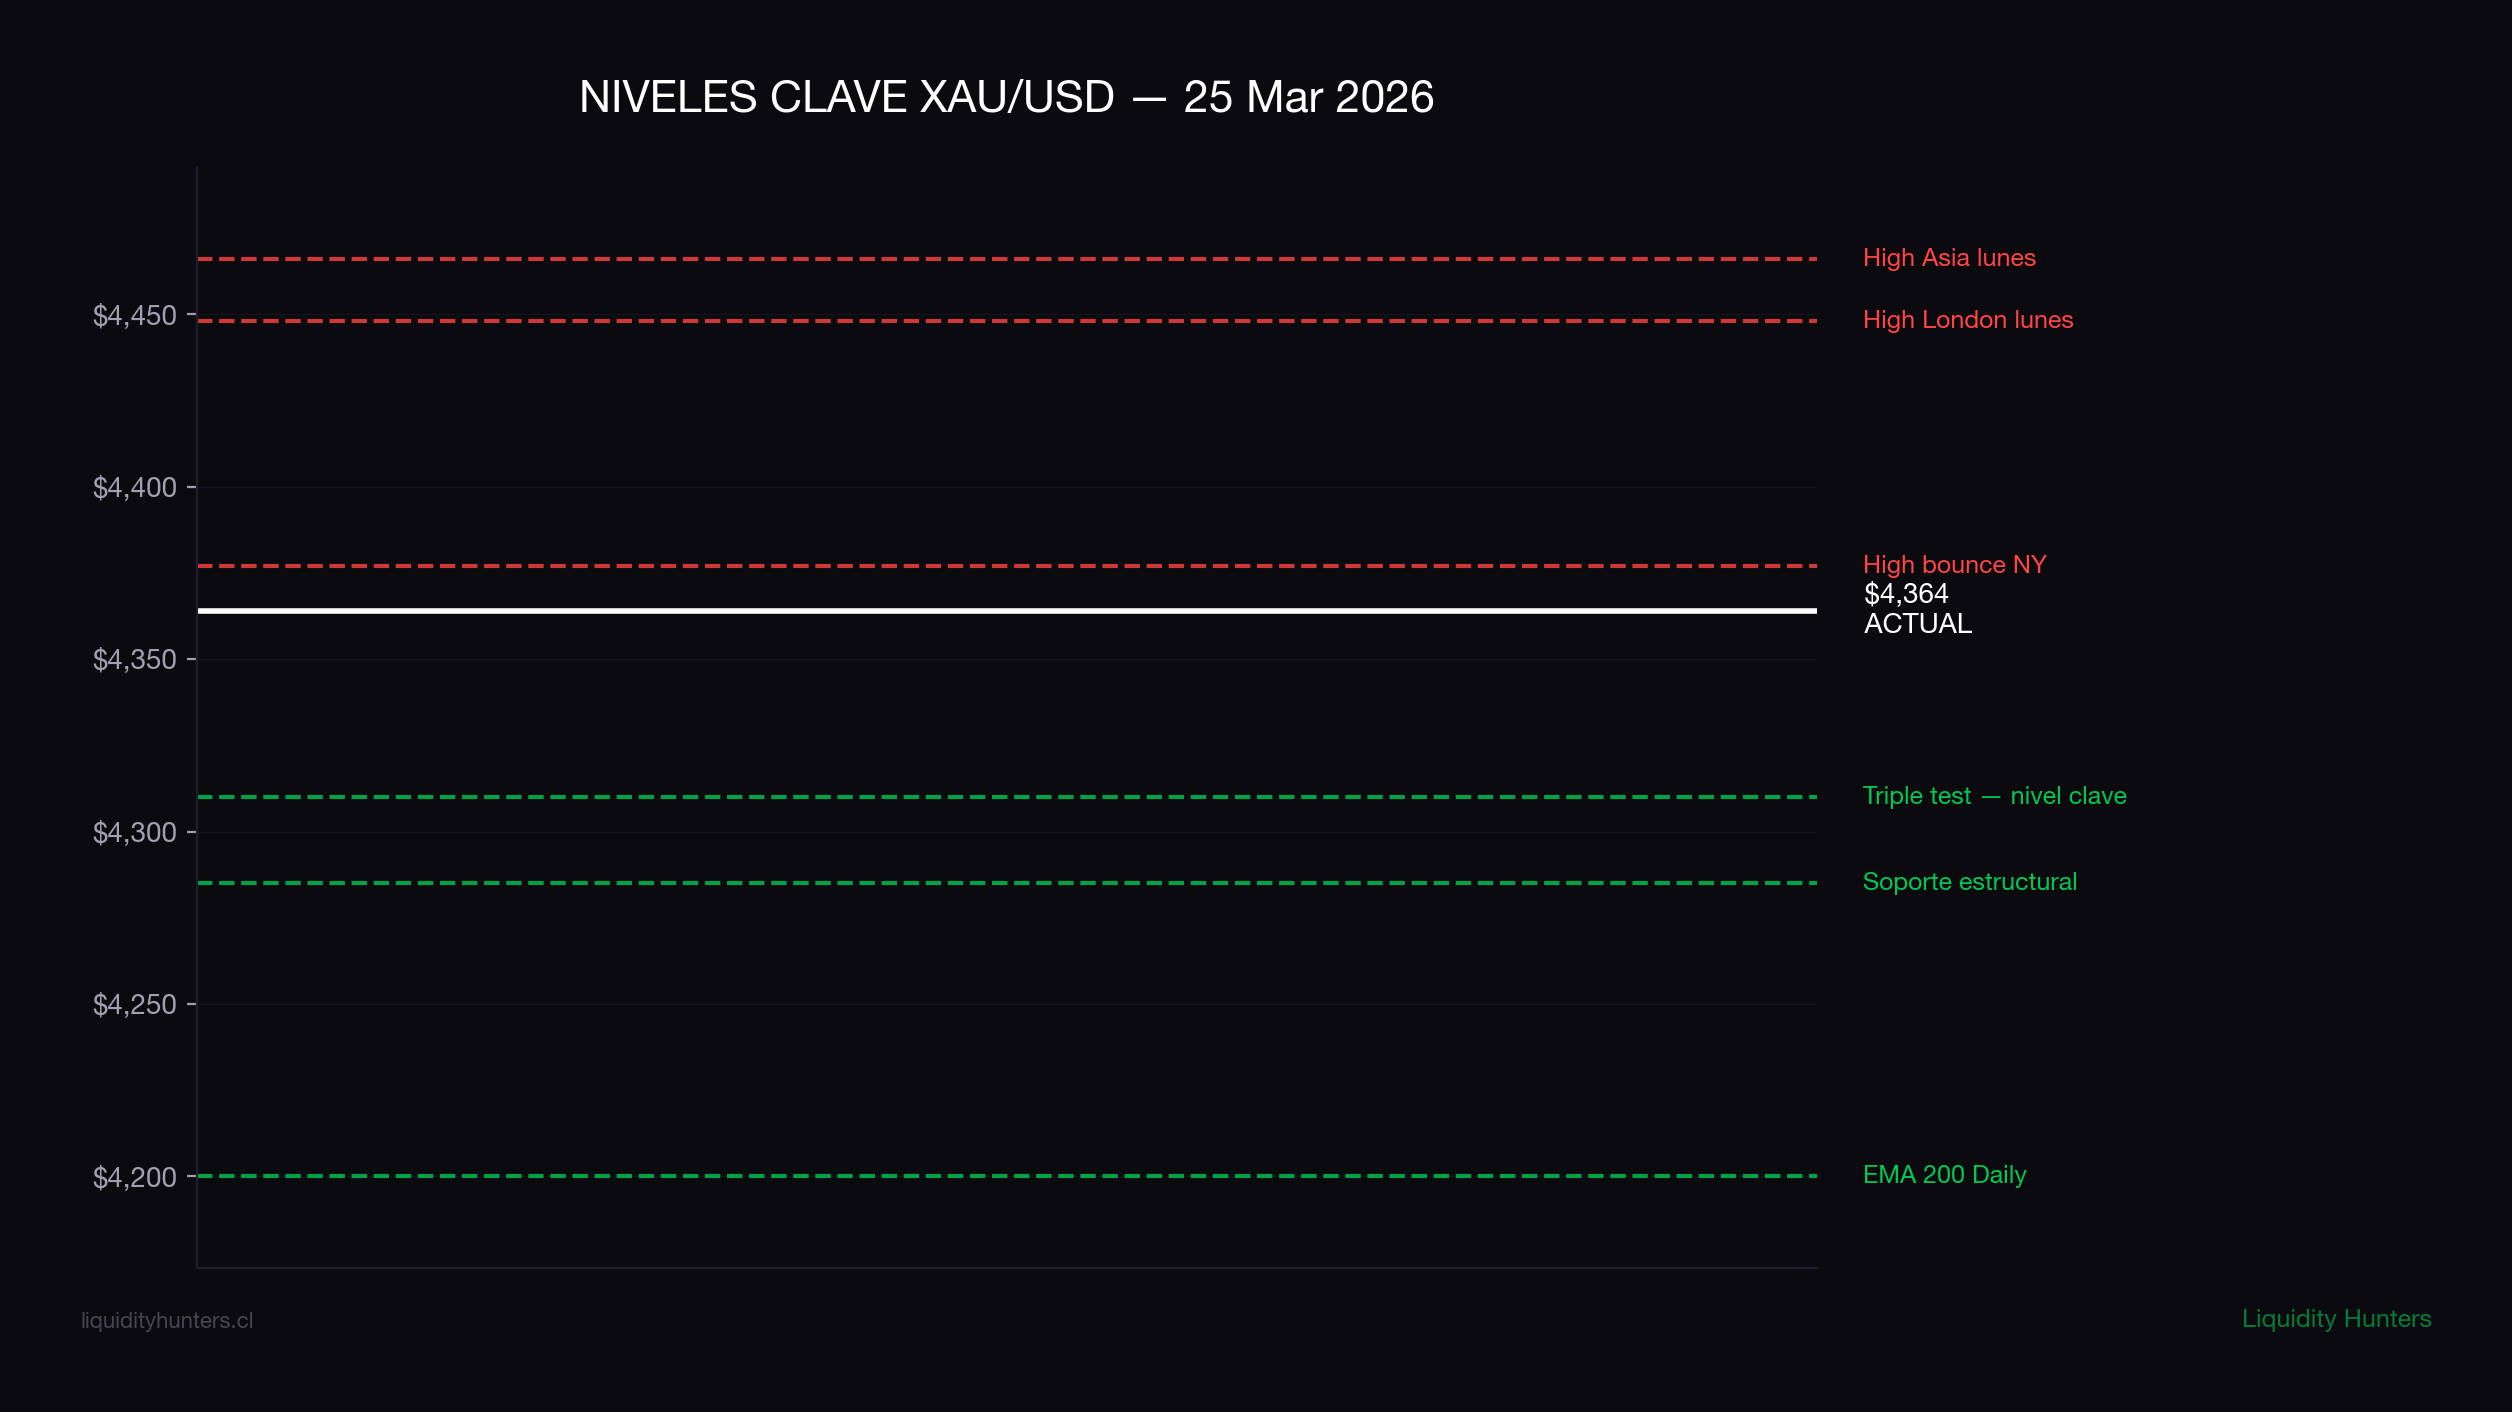
Resistances:
- $4,377 — High of NY bounce. First real resistance.
- $4,448 — High of Monday London. Zone where institutions distributed yesterday.
- $4,466 — High of Monday Asia.
Supports:
- $4,310 — The level of the day. Triple test without breaking. Accumulation of stops below.
- $4,285 — Structural support below the triple test.
- $4,200 — EMA 200 Daily. Long-term bull/bear dividing line.
The central question is simple: Will $4,310 hold or break? If it holds (or is swept and recovers), there is rebound potential. If lost with force, the next serious support is at $4,200.
Institutional Perspective
From an institutional perspective, the triple test of $4,310 tells a story: someone with serious capital is buying there. But to complete their position, they need more sellers. The most efficient way to get them is to sweep the level — activate stops, generate momentary panic, and buy at even better prices. This process is what we call a liquidity sweep.
This mechanism repeats constantly in Gold. The market needs liquidity to move, and below $4,310 there is significant accumulation after 3 tests.
Correlations
| Asset | Price | Change | Impact on Gold |
|---|---|---|---|
| DXY | 99.37 | +0.42% | Negative pressure, but stable |
| US10Y | 4.33% | -1.30% | Positive — yields falling |
| VIX | 26.15 | -2.35% | Elevated but falling |
| Oil | $91.60 | +3.94% | Iran driving Oil |
Key data: 10-year yields fell 1.30%. It’s the only macro driver supporting a Gold rebound today. If yields continue falling, Gold has tailwind.
We detected that VIX and Gold are negatively correlated when historically the correlation is positive. This confirms that the USD remains the preferred safe haven over Gold in this environment.
Calendar
| Day | Event | Impact |
|---|---|---|
| Mar 25 | No data | Clean window |
| Wed 26 | No data | Clean window |
| Thu 27 | Jobless Claims + GDP | Medium |
| Fri 28 | Core PCE | High |
Today and tomorrow are the days with the least macro noise of the week. Price moves on pure structure.
What to Watch in London
Monday established a clear range: $4,310-$4,466. Tuesday historically breaks Monday’s range in Gold — it’s the “Monday range, Tuesday break” pattern we’ve documented in our studies.
The key points for today’s session:
- What happened to $4,310 in Asia: whether it was swept or not
- How London reacts to the levels: the first hour of London (07:00-08:00 UTC) usually defines the direction
- Volume on the move: a breakout without volume is false; a breakout with volume is real
Our detailed analysis with entry levels, risk management, and operational calendar is available in the private report for Premium members.
3 Scenarios
Scenario A — Wyckoff Spring and Bullish Reversal (45%)
Gold sweeps $4,310 briefly (down to $4,285-$4,300), activates stops, and reverses with force. Recovers $4,310 with 1H close. Target: $4,377 first, then $4,448.
Confirmation: Sweep of $4,310 + rapid recovery with buy candle with long lower wick. High volume on recovery.
Scenario B — Range Consolidation (30%)
Gold stays between $4,310-$4,377 without clear direction. Volume drops. Market awaits catalyst. Asia and London don’t define.
Confirmation: Narrow range in 1H. ATR falling. Consecutive doji candles.
Scenario C — Breakout of $4,310 with Bearish Continuation (25%)
Gold loses $4,310 with 1H close below and doesn’t recover. Bearish displacement. Target: $4,285, then $4,200 (EMA 200 Daily). Cancel all bullish bias.
Confirmation: 1H close below $4,310 with body >60%. High volume. No recovery in 2 candles.
Confluence Scorecard
| # | Factor | Points | Justification |
|---|---|---|---|
| 1 | 4H Structure | 0.5/1 | Bearish but with exhaustion |
| 2 | DXY | 0.5/1 | +0.42% — moderate pressure |
| 3 | US10Y | 1/1 | -1.30% — yields falling, positive for Gold |
| 4 | Wyckoff | 1/1 | Phase B — ST holding. Absorption confirmed |
| 5 | Triple test $4,310 | 1/1 | Classic absorption pattern |
| 6 | Calendar | 1/1 | No data today — clean window |
| 7 | VIX | 0.5/1 | 26.15 — elevated but falling |
| 8 | Oil | 0/1 | +3.94% — geopolitics, doesn’t help Gold directly |
| 9 | Silver | 0/1 | No Silver data today |
| 10 | Volume | 0.5/1 | Declining volume on each test |
TOTAL: 6/10
Complete Liquidity Map
======================================================================
 XAU/USD LIQUIDITY MAP
 Pre-London 26 March 2026
======================================================================

--- $4,466 --- BSL | High Asia Monday | +$102 | Prob: LOW
 Short stops. Distribution zone from Monday.

--- $4,448 --- BSL | High London Monday | +$84 | Prob: MEDIUM
 Short stops. If reached = squeeze completed.

--- $4,377 --- BSL | High NY bounce | +$13 | Prob: HIGH
 First resistance. Recent short stops.

=== $4,364 === CURRENT PRICE

--- $4,310 --- KEY SUPPORT | -$54 | Prob test: HIGH <<<
 *** MOST IMPORTANT LEVEL ***
 Triple test. Absorption. Spring potential.
 If holds/swept and recovers = LONG.
 If breaks with force = bias change.

--- $4,285 --- SSL | -$79 | Prob test: MEDIUM
 Structural support. Liquidity pool below $4,310.

--- $4,200 --- SSL | EMA 200 Daily | -$164 | Prob test: LOW
 Bull/bear dividing line. Last serious support.

======================================================================
Setups
Setup A — LONG Spring at $4,310 (FAVORITE)
Type: LONG | Confidence: 45% | Risk: 1%
Context
Wyckoff Spring. Price sweeps $4,310 and recovers. The strongest signal in the methodology.
Execution
| Parameter | Value | Reference |
|---|---|---|
| Entry Zone | $4,310-$4,325 | Post-sweep of $4,310 |
| Trigger | Sweep of $4,310 + recovery with 15m close above $4,318. Candle with long lower wick. | LTF confirmation required |
| Stop Loss | $4,280 (30-45 pips) | Below structural support |
| TP1 | $4,377 (+52-67 pips) — R:R 1:1.5 | Move SL to BE |
| TP2 | $4,448 (+123-138 pips) — R:R 1:3 | Runner |
Position Sizing (1% Risk)
| Account | Lots | Max Loss | TP1 Gain | TP2 Gain |
|---|---|---|---|---|
| $10,000 | 0.029 | -$100 | +$150 | +$400 |
| $25,000 | 0.071 | -$250 | +$375 | +$1,000 |
| $50,000 | 0.143 | -$500 | +$750 | +$2,000 |
| $100,000 | 0.286 | -$1,000 | +$1,500 | +$4,000 |
Active Management
- If TP1 hit → SL to breakeven. Close 50%.
- Runner 50% with trailing stop 35 pips to TP2.
- If no sweep of $4,310 → DO NOT ENTER. Wait for next setup.
- Max time in trade: 6 hours.
Confluences (Checklist)
- Triple test $4,310 — absorption confirmed
- Wyckoff Phase B — ST holding
- US10Y falling — tailwind
- Trigger confirmed on chart (pending)
3/4 pre-trade.
Setup B — LONG Breakout of $4,377
Type: LONG | Confidence: 35% | Risk: 0.75%
Context
If Gold breaks the high of the NY bounce without needing to sweep $4,310 first.
Execution
| Parameter | Value | Reference |
|---|---|---|
| Entry Zone | $4,377 | Resistance breakout |
| Trigger | 1H close above $4,377 + retest holding as support. | LTF confirmation required |
| Stop Loss | $4,345 (32 pips) | Setup invalidation |
| TP1 | $4,448 (+71 pips) — R:R 1:2.2 | Move SL to BE |
Position Sizing (0.75% Risk)
| Account | Lots | Max Loss | TP1 Gain |
|---|---|---|---|
| $10,000 | 0.023 | -$75 | +$163 |
| $25,000 | 0.059 | -$188 | +$419 |
| $50,000 | 0.117 | -$375 | +$831 |
| $100,000 | 0.234 | -$750 | +$1,661 |
Active Management
- If TP1 hit → SL to breakeven. Close 50%.
- Runner 50% with trailing stop 32 pips.
- If no trigger in zone → DO NOT ENTER.
- Max time in trade: 6 hours.
Confluences (Checklist)
- Absorption at $4,310
- US10Y falling
- 1H structure bullish (pending — needs BOS)
- Trigger confirmed on chart (pending)
2/4 pre-trade.
Setup C — Defensive SHORT if $4,310 Breaks
Type: SHORT | Confidence: 25% | Risk: 0.5%
Context
Only if Setup A fails. If $4,310 is lost with force and without recovery. Cancel all longs first.
Execution
| Parameter | Value | Reference |
|---|---|---|
| Entry Zone | $4,310 | Confirmed breakout |
| Trigger | 1H close below $4,310 + retest rejecting as resistance. | LTF confirmation required |
| Stop Loss | $4,340 (30 pips) | Setup invalidation |
| TP1 | $4,285 (+25 pips) — R:R 1:0.8 | Move SL to BE |
| TP2 | $4,200 (+110 pips) — R:R 1:3.7 | Runner to EMA 200 |
Position Sizing (0.5% Risk)
| Account | Lots | Max Loss | TP1 Gain | TP2 Gain |
|---|---|---|---|---|
| $10,000 | 0.017 | -$50 | +$43 | +$187 |
| $25,000 | 0.042 | -$125 | +$105 | +$462 |
| $50,000 | 0.083 | -$250 | +$208 | +$913 |
| $100,000 | 0.167 | -$500 | +$418 | +$1,837 |
Active Management
- If TP1 hit → SL to breakeven. Close 50%.
- Runner 50% with trailing stop 30 pips to TP2.
- If $4,310 recovers after sweep → CANCEL SHORT. Activate Setup A.
- Max time in trade: 6 hours.
Confluences (Checklist)
- Daily structure bearish
- 4H structure bearish
- $4,310 breakout confirmed (pending)
- Trigger confirmed on chart (pending)
2/4 pre-trade.
TradingView Alerts
ALERT 1: XAU/USD crosses $4,310 DOWN
→ Message: "Triple test broken. Evaluate if Spring or real breakout."
→ Frequency: Once only

ALERT 2: XAU/USD crosses $4,377 UP
→ Message: "NY resistance touched. Evaluate breakout or rejection."
→ Frequency: Once only

ALERT 3: XAU/USD crosses $4,285 DOWN
→ Message: "Structural support. Invalidation of long setups."
→ Frequency: Once only

ALERT 4: XAU/USD crosses $4,448 UP
→ Message: "Monday London high reached. Consider partial profits."
→ Frequency: Once only
Rules for Today
- Only 1 trade. Priority: A > B > C.
- Maximum risk: 1% per trade.
- If there’s no trigger, don’t trade. Discipline pays more than activity.
- Critical level: $4,310. If swept and recovers = Spring (Setup A). If lost with 1H close = Short (Setup C).
Summary in Numbers
| Metric | Value |
|---|---|
| Bias | BEARISH (with absorption) |
| Score | 6/10 |
| Setups | 3 |
| Favorite Setup | Setup A: LONG Spring at $4,310 |
| Level #1 | $4,310 |
| Target #1 | $4,377 |
| Target #2 | $4,448 |
| Wyckoff | Phase B — Secondary Test |
Analysis generated by the Liquidity Hunters team. This content is educational and does not constitute financial advice. Trading carries the risk of capital loss.
Trade setups
3 active setups. Entries, stops and targets below — all public. No trigger, no trade.
A. 🟢 LONG — Pullback al soporte ⭐ Favorite
Entry: $4,491 · SL: $4,449 · TP1: $4,528 · R:R 1:0.9 · Risk: 1%
Trigger: CHoCH alcista 5m en $4,491. Cierre de vela 5m con cuerpo >60%.
B. 🟢 LONG — Breakout de resistencia
Entry: $4,528 · SL: $4,482 · TP1: $4,578 · R:R 1:1.1 · Risk: 1%
Trigger: Cierre 1H sobre $4,528 + retest como soporte que aguanta.
C. 🔴 SHORT — Defensivo si soporte quiebra
Entry: $4,491 · SL: $4,521 · TP1: $4,449 · R:R 1:1.5 · Risk: 0.5%
Trigger: Cierre 1H debajo de $4,491 + retest como resistencia.
Replay this day bar by bar in the simulator
Trade the same scenario risk-free: the replay starts on this date and the analysis levels activate on their own as you advance. When you close, the AI scores your decisions.
Open in the simulatorDisclaimer
Educational and informational content. This is not financial advice or a buy/sell recommendation. Trading involves risk of capital loss. Past results do not guarantee future results. Do your own research (DYOR).