Update XAU/USD - Gold drops another $180 on Sunday, hits Yearly Open
XAUUSD analysis update: gold price collapses from $4,497 to $4,314 at Sunday's Asia open. Sweep of the Yearly Open with a $130 bounce. Updated SMC levels and forecast.
What happened since the last analysis
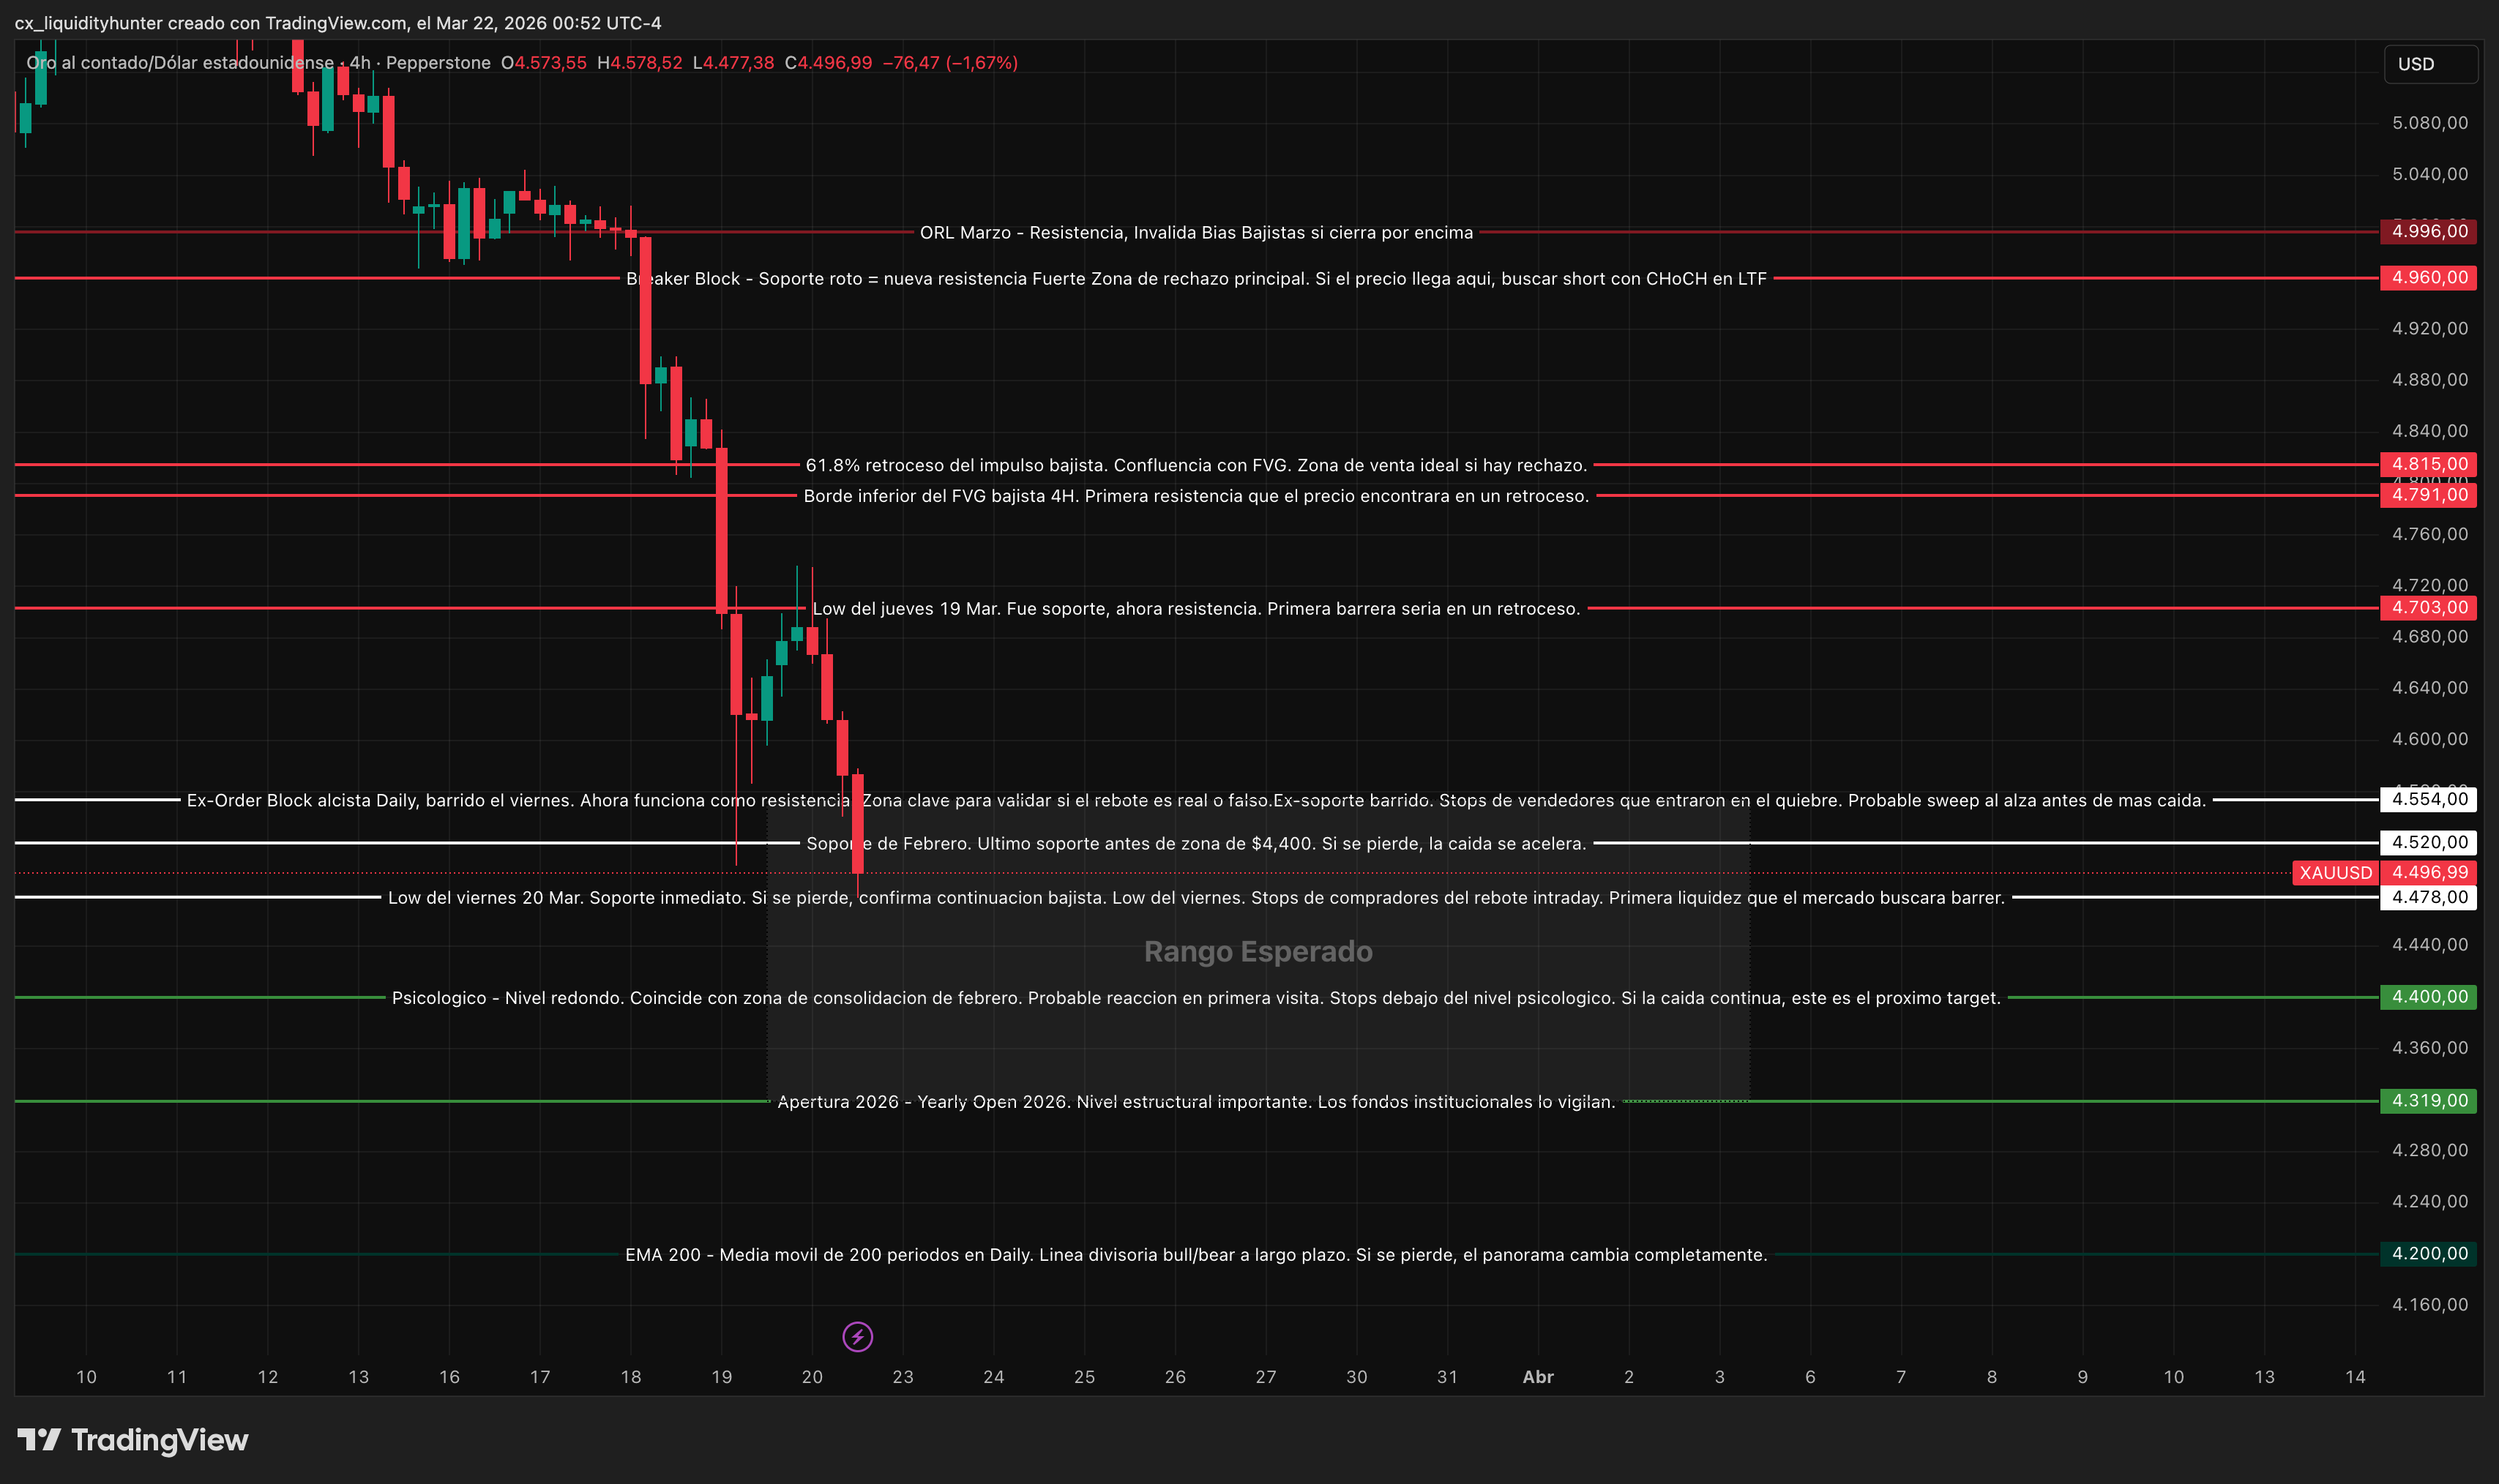
On Friday the 21st we closed our analysis with Gold at $4,497 and an expected range of $4,319 - $4,554 for this week. What we didn’t expect was that the move would start on Sunday night itself.
Asia Open — Sunday Mar 22
Gold opened the Asian session at $4,497 and collapsed straight down:
- $4,478 (weekly low) — swept in the first 30 minutes
- $4,400 (psychological level) — tested 4 times, eventually broken
- $4,319 (Yearly Open) — sweep to $4,314 followed by a $130 bounce to $4,453
The Asian session range on a Sunday was $218 — extraordinarily large and reflecting the ongoing capitulation in Gold.
Previous analysis review — what we got right and what we missed
Hits (75%)
- Perfect liquidity map: $4,478, $4,400 and $4,319 were swept in the exact order we predicted, with the correct probabilities (VERY HIGH, HIGH, MEDIUM)
- Yearly Open ($4,319) as a key level: identified as “the most important support” — the sweep to $4,314 with a $130 bounce confirmed its institutional relevance
- Expected range: we predicted $4,319-$4,554, the actual range was $4,314-$4,532. Less than 5% error
- Bearish bias as the main scenario (70%): confirmed convincingly
Misses
- We expected a retracement to $4,554 before the drop: it didn’t happen. In capitulation, price drops straight down without retracing to distant resistance levels
- Timing: the big move came during Sunday’s Asia session, not during London/NY as we expected
Key takeaway
In panic-driven markets, retracements don’t reach distant levels. Support levels break in a cascade and the only buying opportunity is at the strongest level (in this case, the Yearly Open). Going forward, we will include “cascade” setups in addition to retracement setups.
Current situation
Price: ~$4,368 (Sunday night Asia) Weekly balance: from $5,017 (Monday) to $4,368 = -12.9%
Structure
The structure is bearish across all timeframes except Daily (which maintains a long-term bullish bias but is deteriorating):
| TF | Bias | Structure |
|---|---|---|
| Daily | Bullish (long-term) | Holding but under pressure |
| 4H | BEARISH | Confirmed bearish BOS |
| 1H | BEARISH | Bearish BOS |
| 15M | BEARISH | Multiple bearish BOS |
Updated levels
| Level | Type | Context |
|---|---|---|
| $4,314 | Asia Low / Yearly Open sweep | Key support. If lost, target $4,285 |
| $4,350 | Current consolidation | Indecision zone |
| $4,400 | Former support, now resistance | Bearish FVG between $4,368-$4,406. Sell zone |
| $4,453 | Asia bounce high | Strong resistance. Short stops above |
| $4,497 | Bear OB A+ (CHoCH) | Institutional resistance |
Indicators
- RSI Daily: 19.7 — historically oversold. Haven’t seen sub-20 in months
- RSI 1H: 20.2 — also oversold
- ATR Daily: $119 — extreme volatility (normal is ~$50-60)
- DXY: 99.65, stable — not actively driving the drop
Outlook for the week of March 24-28
Bearish scenario (60%)
London sweeps the Asia high ($4,453) to capture short stops, then drops to re-test $4,314 and potentially $4,285. Friday’s Core PCE comes in hot, confirming the hawkish narrative.
Bullish scenario (40%)
Sub-20 RSI on Daily triggers a technical short squeeze. Gold rallies to $4,478-$4,554 (former support now resistance). Only sustainable if Core PCE comes in low.
Key event: Core PCE Friday March 28
The most important data release of the week. If it comes in high (>0.4%), Gold could drop to $4,200 (Daily 200 EMA). If it comes in low (<0.3%), short squeeze toward $4,554+.
Glossary of terms used
| Term | Definition |
|---|---|
| Yearly Open | Opening price on the first trading day of the year. Institutional level that defines whether the year is bullish or bearish |
| Liquidity Sweep | A move that sweeps stops accumulated at a level and then reverses |
| BOS | Break of Structure — a break of a swing high/low confirming trend continuation |
| FVG | Fair Value Gap — a price imbalance across 3 candles where no fair negotiation took place |
| RSI sub-20 | Relative Strength Index below 20. Indicates an extreme oversold condition |
Disclaimer: This analysis is for educational purposes only. It is not financial advice. Trading carries the risk of capital loss.
Disclaimer
Educational and informational content. This is not financial advice or a buy/sell recommendation. Trading involves risk of capital loss. Past results do not guarantee future results. Do your own research (DYOR).