XAU/USD Weekly Analysis - March 21, 2026
XAUUSD weekly forecast: gold price collapses over 10%, closes at $4,497. All support levels broken. SMC analysis with new levels and projection for March 24-28.

Weekly Summary
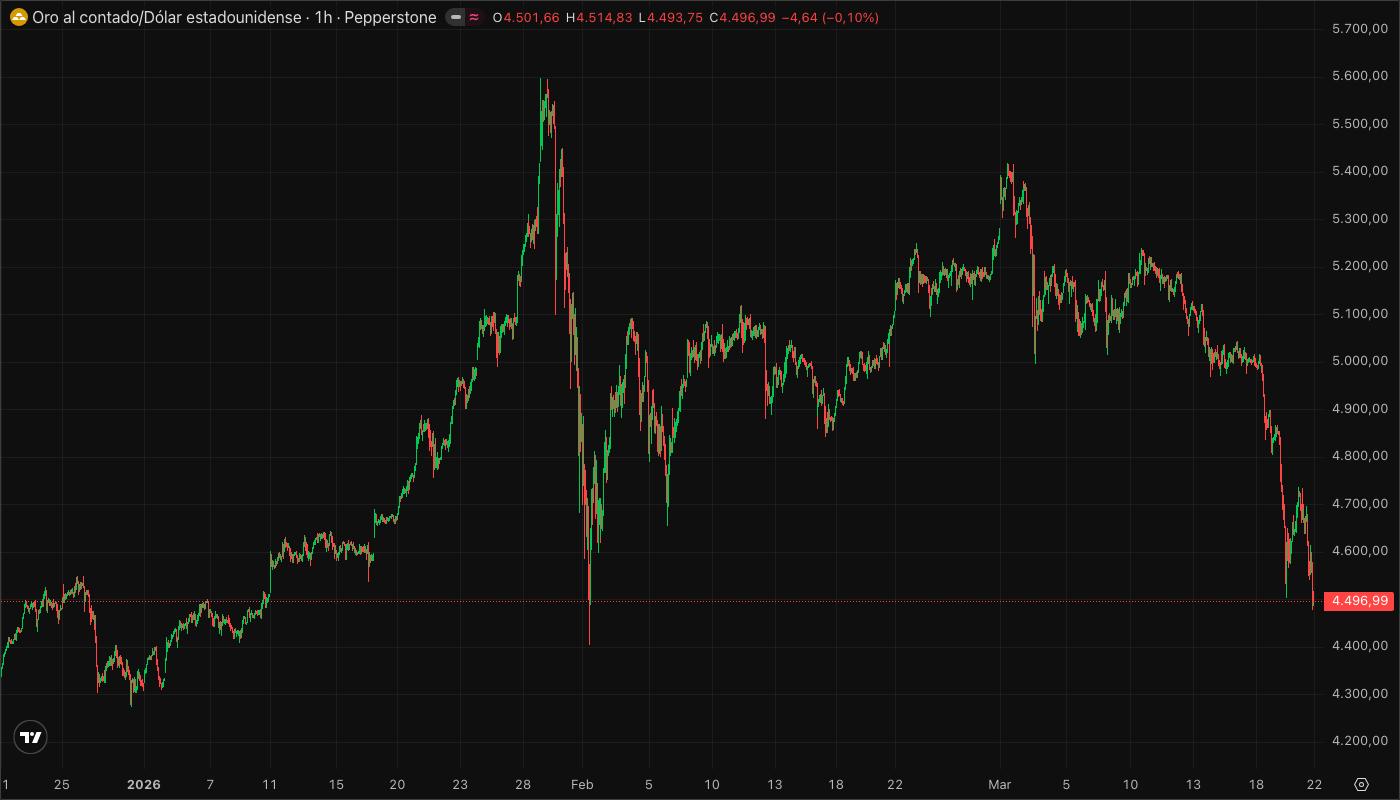
Historic week for gold. XAU/USD collapsed from $5,000 to a weekly close of $4,497 (Pepperstone) / $4,575 (GC=F Futures), with a low of $4,478 on Friday, March 20th. A drop of more than 10% for the week. What started as a technical correction turned into an accelerated capitulation driven by macro factors and forced liquidations.
Multiple support levels were destroyed in cascade: $4,960, $4,815, $4,703, $4,554, and $4,520 — all swept with no significant reaction. The price closed below all previously identified supports, leaving multiple Fair Value Gaps unfilled along the way and now trading in February territory.
Macro Context
The Catalyst: Middle East Conflict and Oil Shock
The escalation of the Middle East conflict generated an oil price shock, spiking inflation expectations. The Fed’s reaction was immediate: the tone turned markedly hawkish, with several FOMC members suggesting that rate cuts are off the table while energy inflation is not controlled.
Why Did Gold Fall if There’s Uncertainty?
It seems contradictory, but it has institutional logic:
- Margin calls: volatility in equities and oil forced liquidations in gold to cover margins.
- Dollar strength: hawkish Fed expectations pushed the DXY, pressuring commodities.
- Profit-taking: gold had come off a historic rally above $5,000. Funds took profits aggressively.
- Rotation to cash: in moments of extreme panic, cash (USD) is the true safe haven, not gold.
SMC Technical Analysis
Market Structure
The structure in Daily and 4H is clearly bearish. We have a clean sequence of:
- CHoCH at $5,080 which was the first sign of weakness (change of character)
- Bearish BOS breaking $4,960 (previous swing low of the consolidation range)
- Second bearish BOS breaking $4,520 (structural support from February)
- Formation of Lower Highs and Lower Lows consistent: $5,400 → $5,230 → $5,001 → $4,738 → close $4,497
The price closed below all previous supports, now trading in an accelerated downtrend channel. There is no sign of accumulation or a brake on any timeframe.
Wyckoff Reading
This week’s move fits the MARKDOWN phase (Phase D/E) of the Wyckoff distribution scheme that began in the $5,200-$5,400 zone. The rally above $5,000 was the UTAD (Upthrust After Distribution) — one last attempt by market makers to attract buyers before dumping inventory massively. The fall from $5,017 to $4,478 was vertical, with rising volume and no significant bounces, confirming the presence of dominant institutional supply.
The close at $4,497 could be near a Selling Climax (SC) — the first event of the accumulation phase. Signals to watch next week: extreme volume spike at a new low followed by automatic bounce (Automatic Rally toward $4,554-$4,600), then a Secondary Test of the low. If price forms a range between $4,400 and $4,554 with declining volume, we would be looking at the start of Wyckoff re-accumulation. Until that occurs, the main reading is active markdown and we should not anticipate floors.
Relevant Order Blocks
- Daily bearish OB at $4,960-$4,996: Bearish Breaker Block. If price returns here it would be the strongest resistance. Far from current price.
- 4H bullish OB at $4,700-$4,720: partially mitigated during Thursday’s fall. No longer fresh — weak reaction if price returns.
- Daily bullish OB at $4,520-$4,554: swept Friday — price moved through it and closed below ($4,497). This OB was invalidated and now functions as resistance. If price returns to this zone, it will be key to observe if there’s rejection (confirms bearish) or reclaim (first bullish sign).
- Next bullish OB: look for zone of $4,300-$4,400 in the context of January-February consolidation. Requires 4H analysis when market opens.
Fair Value Gaps
The fall left multiple bearish FVGs unfilled between $4,554 and $4,960. These gaps represent imbalance that price could seek to fill in a pullback:
- 4H bearish FVG: $4,870-$4,920 (unfilled — far)
- 4H bearish FVG: $4,815-$4,850 (unfilled — far)
- 4H bearish FVG: $4,600-$4,650 (unfilled — probable first target of a pullback)
- 1H bullish FVG: $4,690-$4,710 — completely crossed. No longer relevant as support.
Liquidity
- Sell-side liquidity (below price): accumulated at $4,478 (Friday low) and $4,400 (psychological level). These are the next targets if the fall continues.
- Buy-side liquidity (above price): at $4,554 (ex-OB swept, stops from sellers who entered the break). A sweep of this zone is likely before the fall continues — classic “pullback to trap buyers” before more downside.
Key Levels for the Week (Mar 24-28)
Resistances (Broken Supports = New Resistances)
| Level | Type | Strength | Description |
|---|---|---|---|
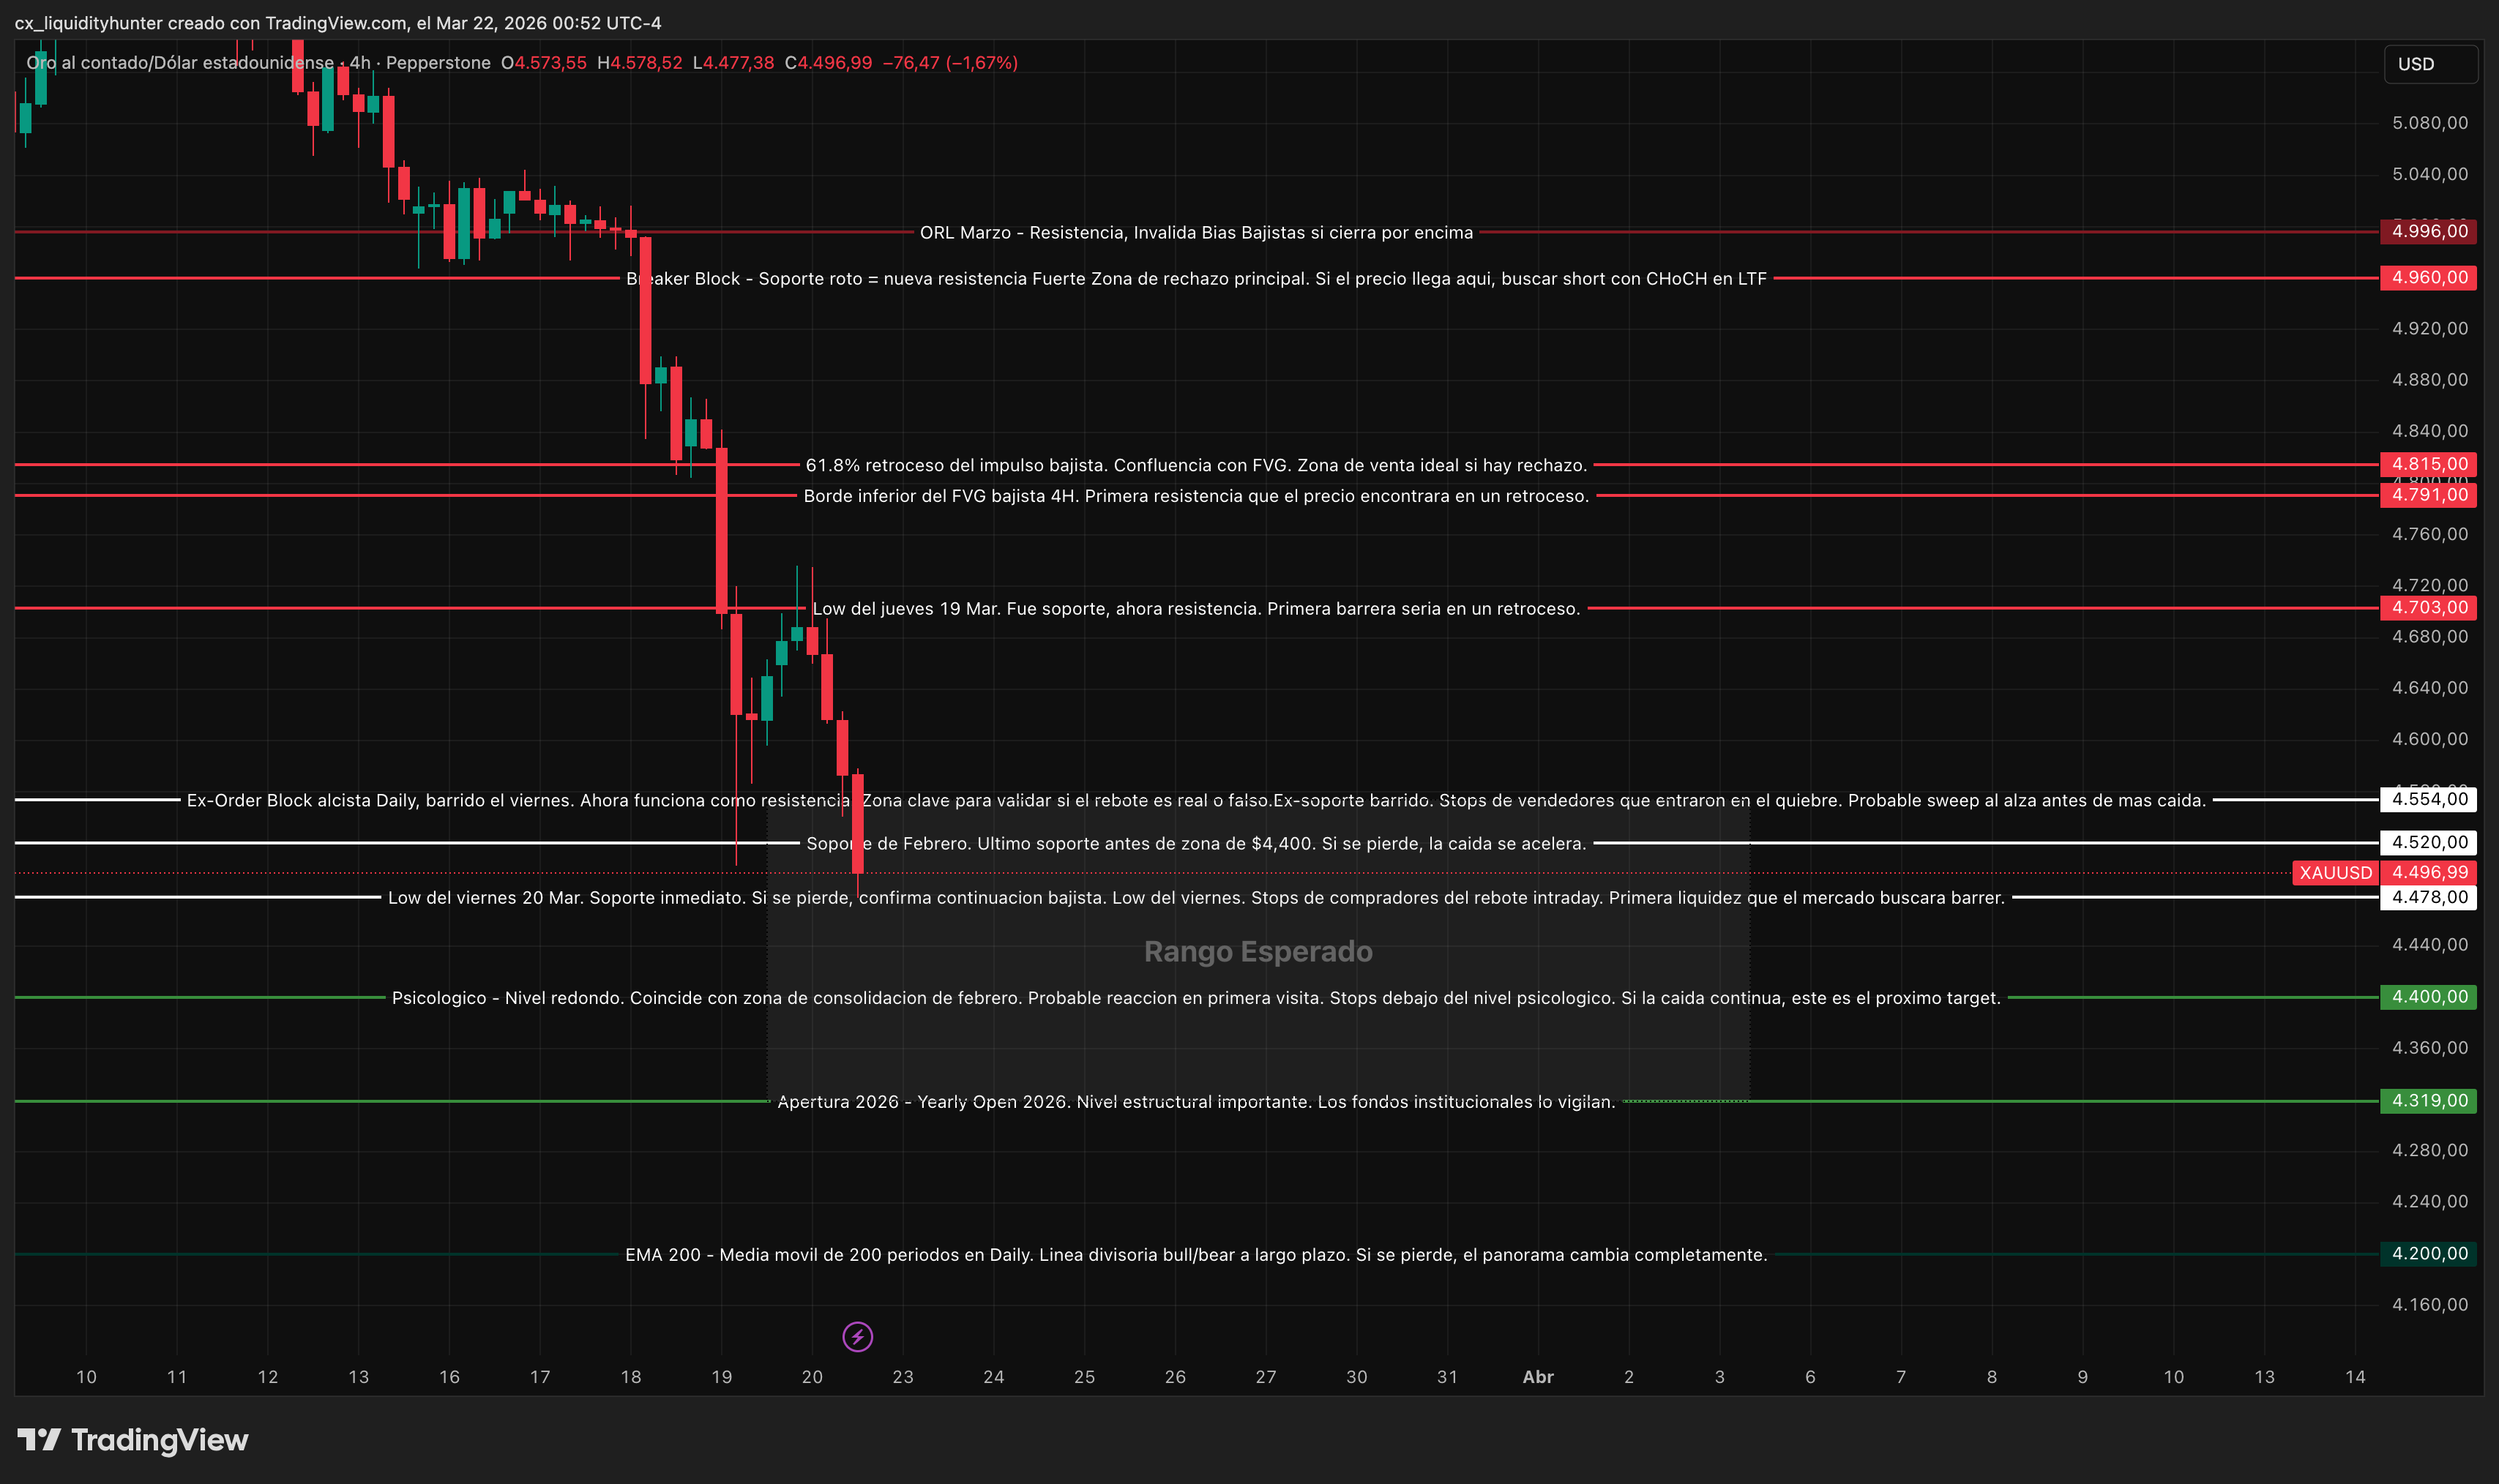
| $4,996 | Resistance | Strong | March Opening Range Low (ORL). Key monthly level. Far — complete invalidation of bearish bias. |
| $4,960 | Breaker Block | Strong | Ex-major support now Breaker Block. Main rejection zone if deep pullback occurs. |
| $4,815 | Fibonacci | Medium | 61.8% retracement of bearish impulse. Confluence with 4H FVG. Very far from current price. |
| $4,703 | Ex-support | Medium | Thursday, Mar 19 low. Was support, now resistance. First barrier would be in a pullback. |
| $4,554 | Ex-OB | Medium | Ex-Daily bullish Order Block, swept Friday. Now functions as resistance. Key zone to validate if bounce is real or false. |
Supports (New, Below Current Price $4,497)
| Level | Type | Strength | Description |
|---|---|---|---|
| $4,478 | Weekly low | Weak | Friday, Mar 20 low. Immediate support. If lost, confirms continued downside. |
| $4,400 | Psychological | Medium | Round level. Coincides with February consolidation zone. Probable reaction on first visit. |
| $4,319 | Yearly Open | Strong | Yearly Open 2026. Important structural level. Institutional funds monitor it. |
| $4,200 | 200-EMA Daily | Strong | 200-period moving average on Daily. Bull/bear dividing line long-term. If lost, the outlook changes completely. |
Pending Liquidity
| Level | Type | Description |
|---|---|---|
| $4,478 | Sell-side | Friday low. Stops from intraday bounce buyers. First liquidity the market will seek to sweep. |
| $4,400 | Sell-side | Stops below psychological level. If fall continues, this is next target. |
| $4,554 | Buy-side | Ex-support swept. Stops from sellers who entered the break. Likely upside sweep before more downside. |
Expected Range
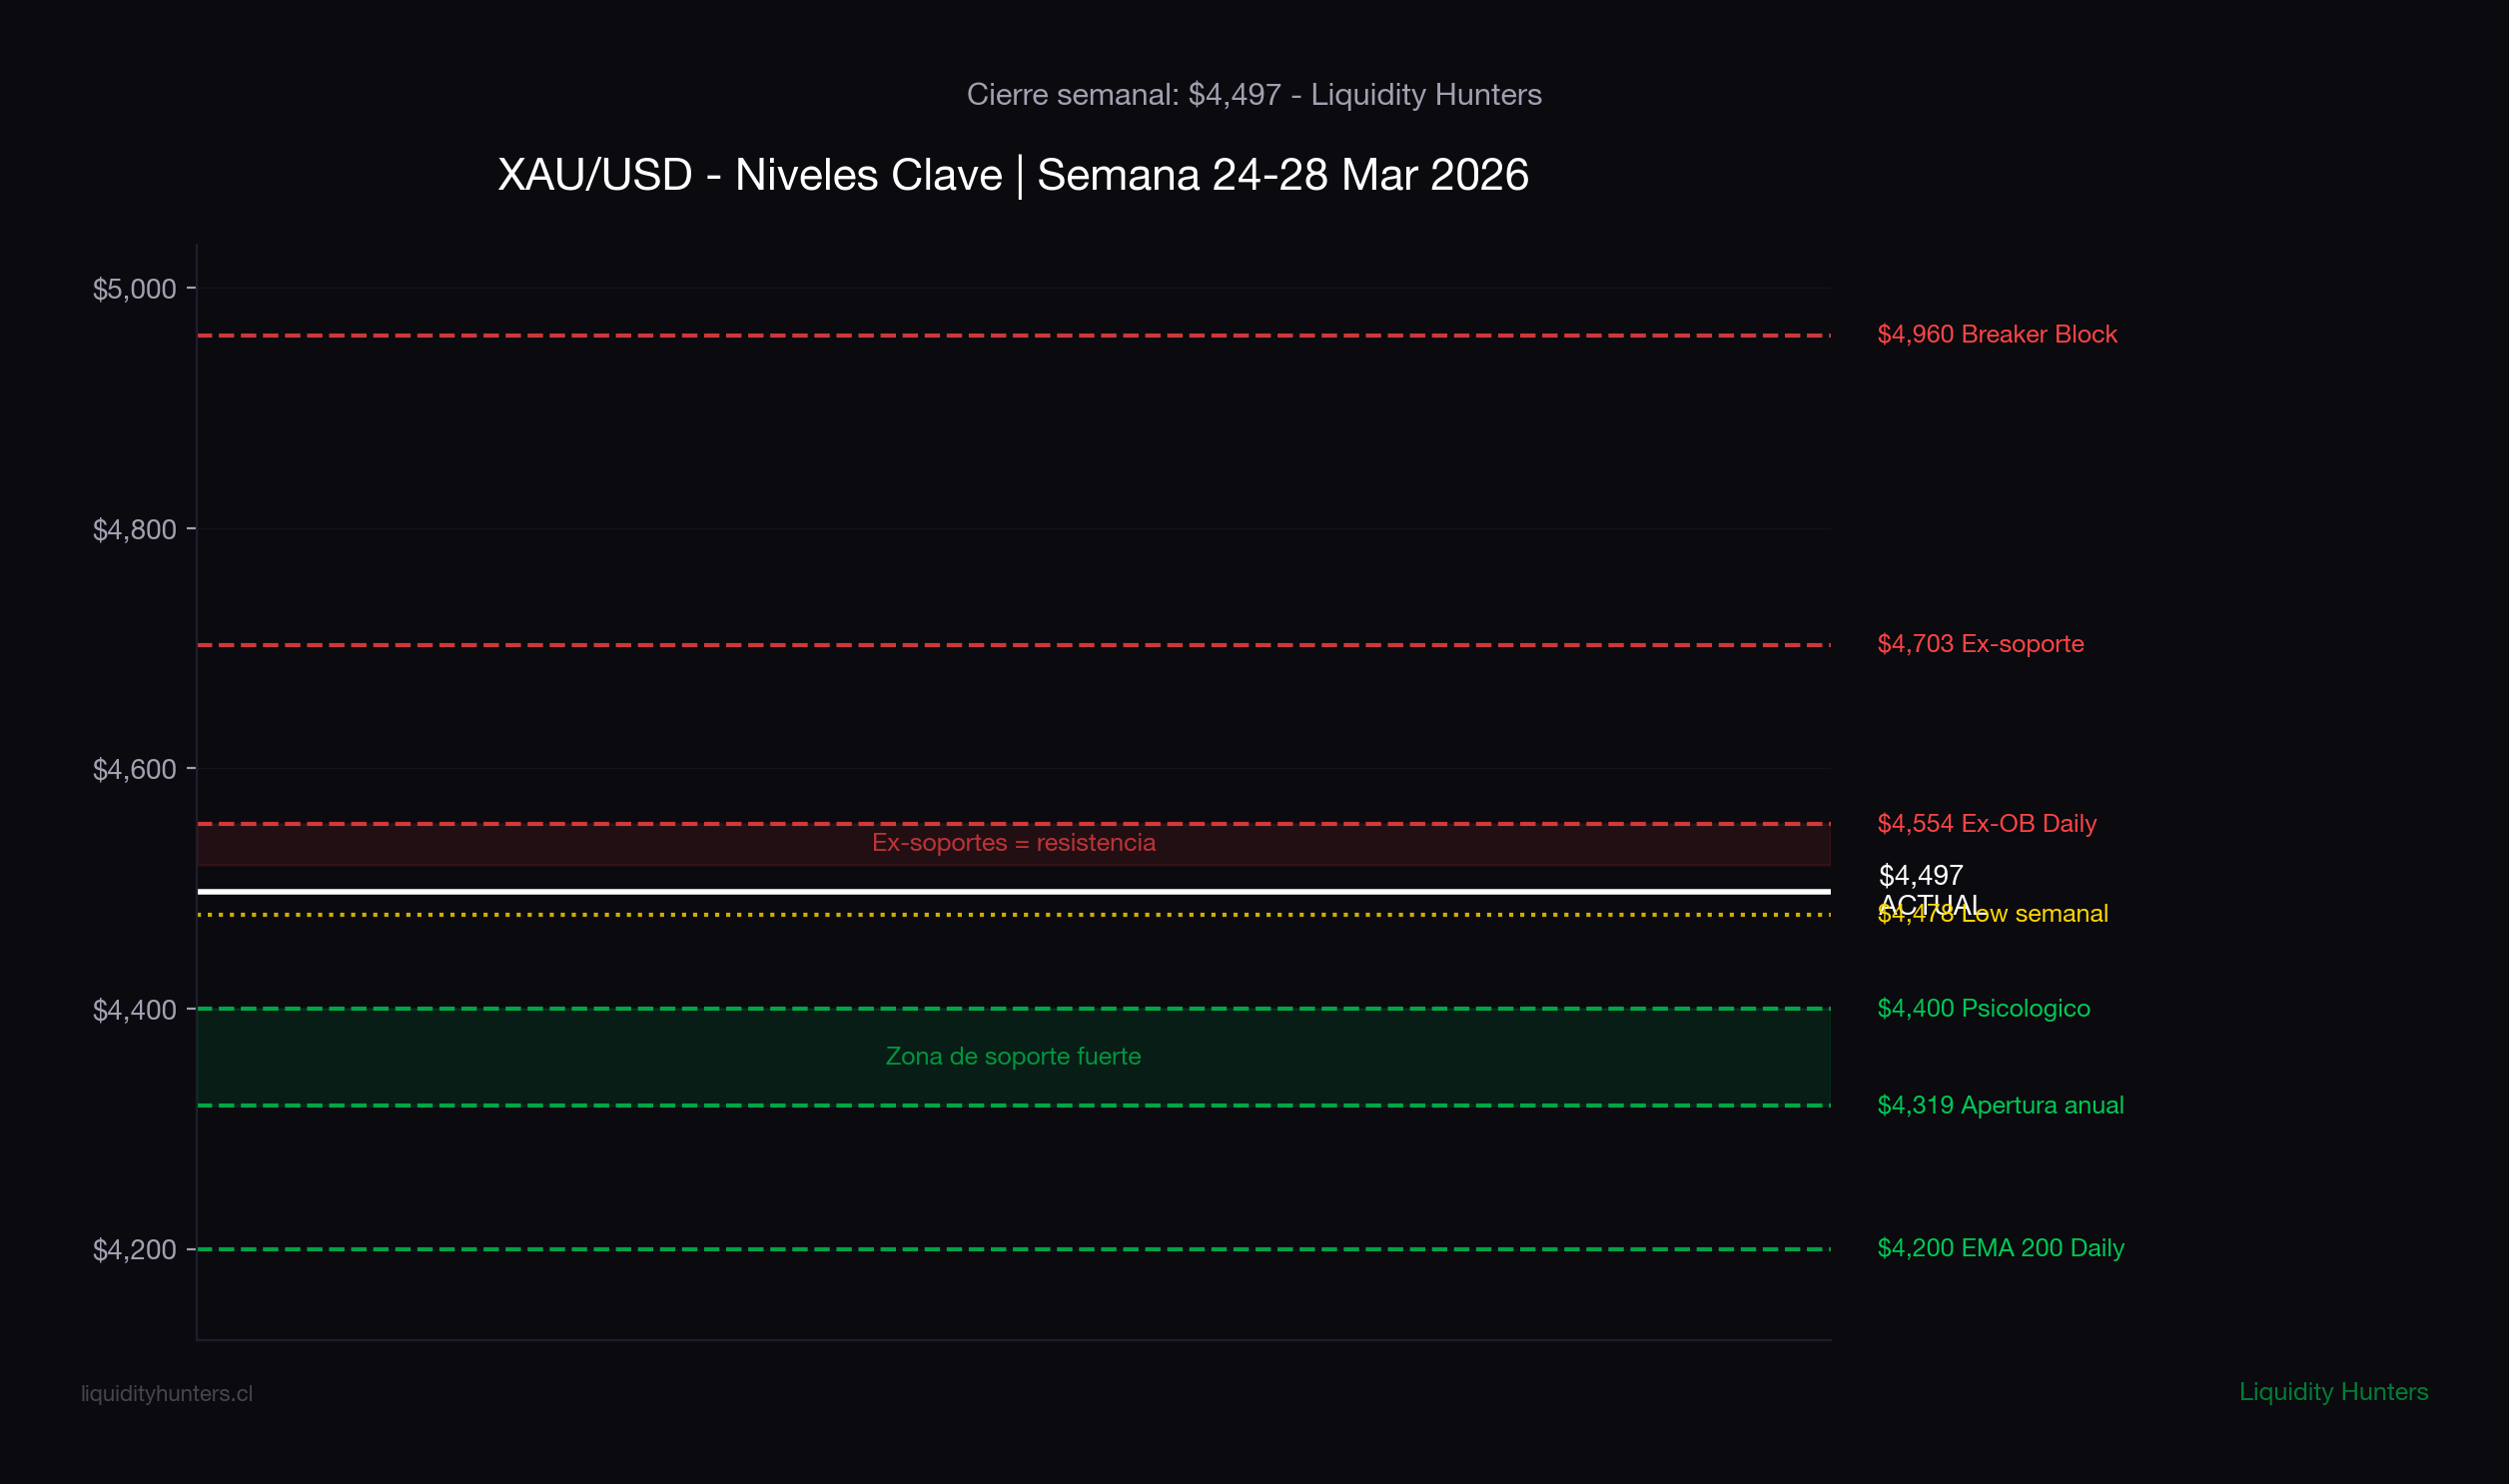
Based on current ATR (extremely elevated) and close at $4,497, the expected range for next week is $4,319 - $4,554, with potential for expansion if Friday’s Core PCE surprises. A close above $4,554 would be the first sign of stabilization.
Correlations
| Asset | Direction | Impact on Gold | Current State |
|---|---|---|---|
| DXY | Inverse | DXY rises → Gold falls | DXY strengthened by hawkish narrative. Downward pressure on XAU. |
| US10Y (Yields) | Inverse | Yields rise → Gold falls | Yields rising on inflation expectations. Negative for Gold. |
| Oil (WTI) | Mixed | Oil shock → inflation → hawkish Fed → Gold falls | Oil surging on Middle East conflict. Main catalyst for the fall. |
| SPX (S&P 500) | Mixed | Panic in equities → margin calls → forced gold selling | Equities under pressure. Cross-market liquidations impacted Gold. |
| BTC | Positive (recent) | Both react to global liquidity | BTC also corrected this week. Confirms global risk-off. |
3 Scenarios for the Week of Mar 24-28
Scenario 1: Bearish — Continued Markdown (70%)
With weekly close at $4,497, all previous supports are broken. Price may attempt a pullback toward the $4,554 zone (Daily ex-OB now resistance), show rejection, and continue the fall toward $4,400 and potentially $4,319 (yearly open).
Confirmations needed:
- Rejection with bearish displacement on retest of $4,554
- Bearish CHoCH on 15m or 5m in zone $4,520-$4,554
- Loss of weekly low ($4,478) with volume
Invalidation: 4H candle close above $4,703.
Scenario 2: Bullish — Technical Bounce / Short Squeeze (20%)
Price forms a bottom in zone $4,478-$4,497, builds accumulation with narrow range Mon-Wed, and generates bullish BOS toward $4,554 first and $4,703 as extended target. This scenario requires Friday’s Core PCE to come in below expectations, weakening the hawkish narrative.
Confirmations needed:
- Double bottom or sweep + reclaim of low $4,478 with bullish displacement
- Bullish CHoCH on 4H (close above $4,554)
- Rising volume and weakening DXY
Invalidation: close below $4,400 on 4H.
Scenario 3: Neutral — Range Consolidation (10%)
After the vertical fall, price enters a lateral range between $4,478 and $4,554 for most of the week. Declining volume, small-bodied candles, wicks in both directions. This would be consistent with the start of Wyckoff accumulation phase (post-Selling Climax range). Definition would come with Friday’s PCE.
Confirmations needed:
- Price contained within $4,478-$4,554 for 3+ days
- Declining volume day by day
- No clear BOS on 4H in either direction
Invalidation: any 4H close outside $4,400-$4,600 range.
Macro Events for Next Week
| Day | Event | Impact |
|---|---|---|
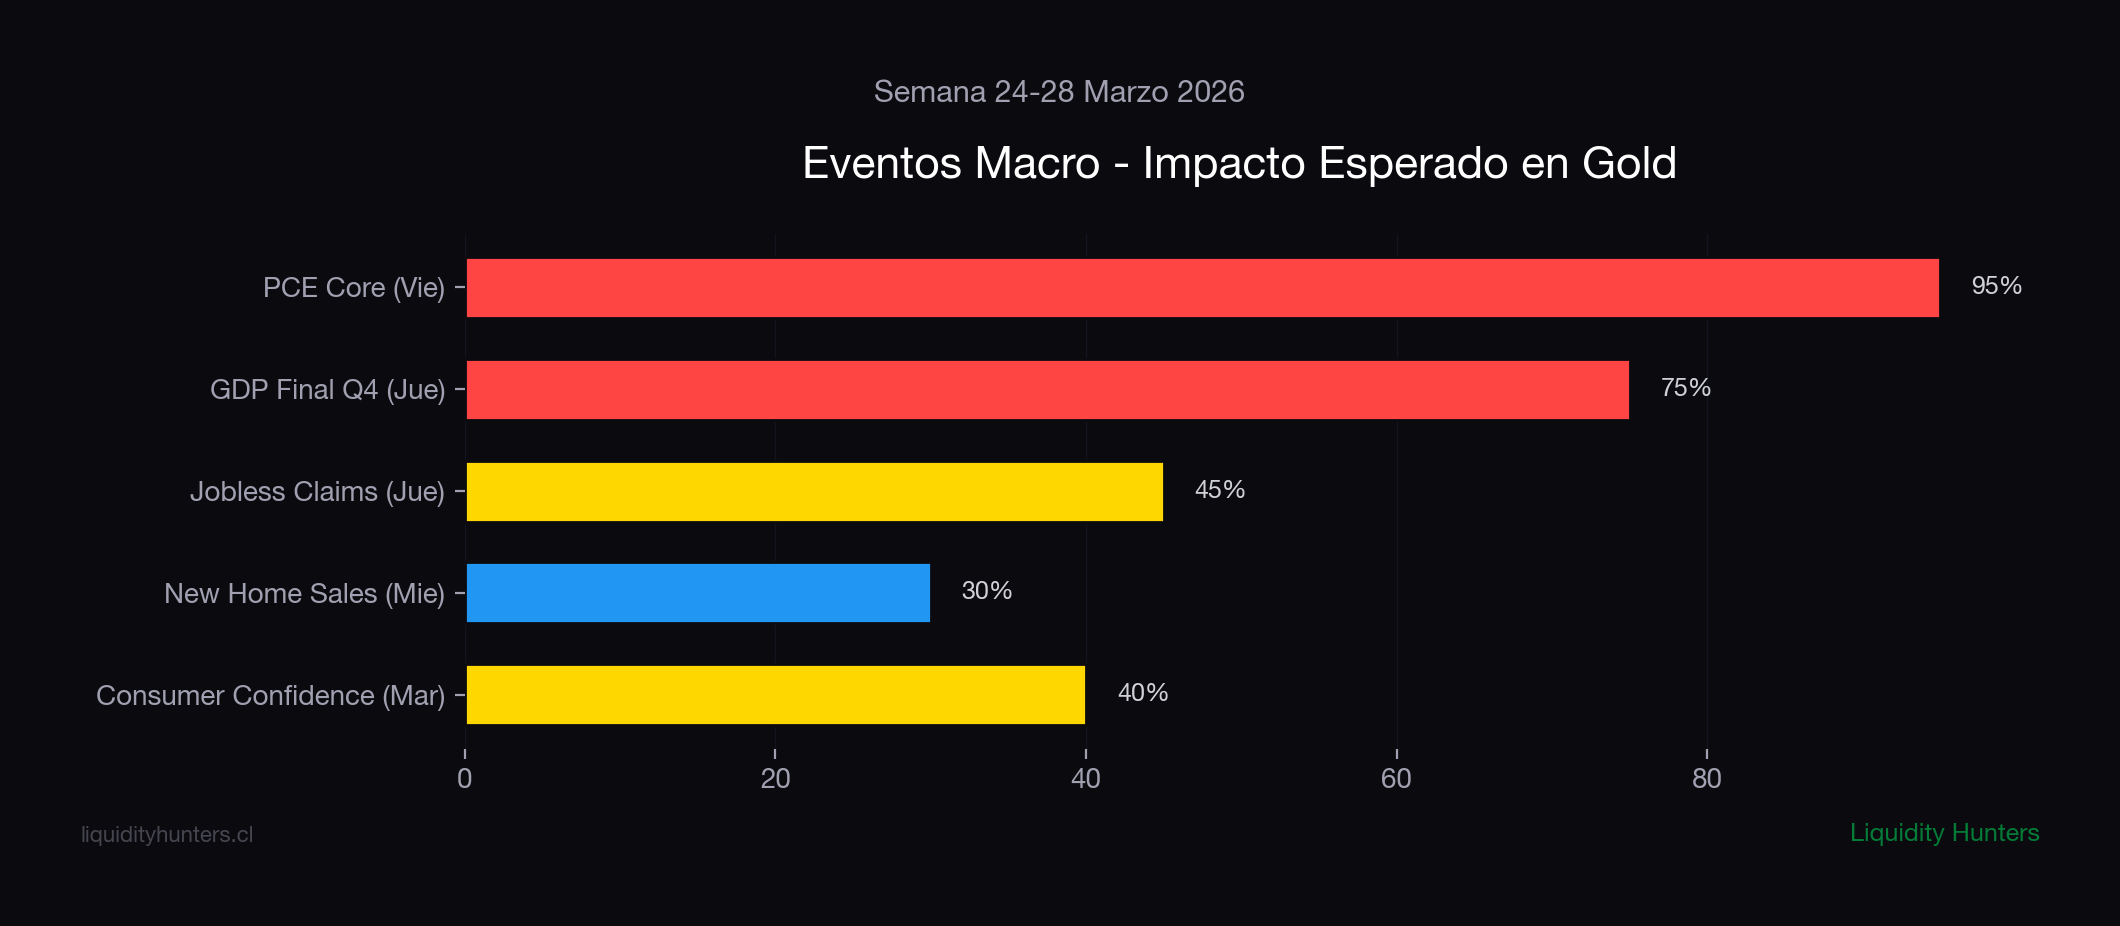
| Tuesday | Consumer Confidence (March) | Medium-High |
| Thursday | GDP Final Q4 | Medium |
| Friday | Core PCE (February) | VERY HIGH |
Friday’s Core PCE: The Event of the Week
The Personal Consumption Expenditures Core on Friday is the most important data point of the week. It’s the Fed’s preferred inflation measure. A print above expectations will reinforce the hawkish narrative and pressure gold. A print below could provide relief and generate technical short squeeze.
High PCE scenario (>0.4% MoM): Gold falls toward $4,400-$4,319 (yearly open). Dollar strengthens. Hawkish narrative intensifies. Low PCE scenario (<0.3% MoM): Gold bounces toward $4,554-$4,703 (ex-supports). Short squeeze possible given the overstretched move.
Weekly Scorecard
| Criteria | Value | Note |
|---|---|---|
| Bias | Bearish | Bearish structure on D1, 4H, 1H |
| Score | 3/10 | Overstretched, no support, high uncertainty |
| Confidence | Low | Extreme volatility reduces clean setups |
| Min R:R | 1:2 | Require minimum 1:2 given elevated ATR |
| Max risk per trade | 0.5% | Halved due to volatility |
| Setups identified | 2 | Short at $4,520-$4,554 / Long at $4,319-$4,400 |
| Recommended sessions | London KZ, NY KZ | Avoid entire Asia session this week |
| Day to avoid | Monday | Confusing range post-capitulation |
Trading Plan
- Weekly bias: bearish while price stays below $4,554. If it recovers $4,554 with strength, bias turns neutral.
- Main sell zone: $4,520-$4,554 (ex-supports now resistance). Look for rejection with bearish CHoCH on 15m/5m.
- Bounce buy zone: $4,400-$4,319 (psychological + yearly open). Only for scalps or short swing. DO NOT hold longs without clear confirmation.
- Risk management: maximum 1% per trade. Volatility is extreme — daily ATR is over $200+. Reduce position size to half normal.
- DO NOT trade Monday: after a week like this, Monday tends to be confusing range day. Wait for market to define direction Tuesday/Wednesday.
- Friday PCE: reduce exposure Thursday evening. Don’t hold large positions pre-data.
Trading Hours and Killzones
Trade exclusively in London and NY Killzones. Avoid Asia this week (unpredictable ranges with this volatility).
| Session | Time (UTC) | Time (EST/NY) | Expected Behavior |
|---|---|---|---|
| Asian Killzone (ICT) | 00:00 - 04:00 | 20:00 - 00:00 | Forms the range and liquidity (equal H/L) that London will sweep. DO NOT trade this week. |
| Tokyo Session | 00:00 - 09:00 | 20:00 - 05:00 | Range/consolidation. Low volatility in Gold. |
| London Killzone (ICT) | 07:00 - 10:00 | 02:00 - 05:00 | Main breakout. Asian Range sweep. BEST WINDOW to trade. |
| London Session (LSE) | 08:00 - 16:30 | 03:00 - 11:30 | Highest global volume session (35% of forex). |
| NY Killzone (ICT) | 12:00 - 15:00 | 07:00 - 10:00 | Second impulse. Macro data released at 12:30 UTC (8:30 EST). High volatility. |
| NY Session (NYSE) | 13:30 - 22:00 | 08:30 - 17:00 | Overlap with London (13:30-16:30) = peak volatility. |
| London Close KZ (ICT) | 15:00 - 17:00 | 10:00 - 12:00 | Frequent manipulation. Reversals. Institutional position closes. |
| NY PM | 17:00 - 22:00 | 12:00 - 17:00 | Declining volume. Only hold positions, don’t open new ones. |
Note: ICT Killzone times are fixed to EST (New York). During daylight saving (EDT, Mar-Nov) they shift 1 hour forward in UTC. Check the Calendar page for your local time automatically.
Recommendation for this week:
- Tuesday-Thursday: trade London Killzone (07:00-10:00 UTC) and NY Killzone (12:00-15:00 UTC)
- Friday (PCE): DO NOT trade before 12:30 UTC. Wait for data, wait for spike, seek sweep + entry after 13:00 UTC
- Avoid: entire Asian session and NY PM (17:00-22:00 UTC)
TradingView Alerts
Configure the following alerts on TradingView for the week of Mar 24-28:
| Alert | Level | Type | Action |
|---|---|---|---|
| Ex-OB Resistance | $4,554 | Cross above | Observe rejection for short. If closes 4H above, bias turns neutral. |
| Breaker Resistance | $4,703 | Cross above | Invalidation of bearish scenario. Close shorts. |
| Weekly low support | $4,478 | Cross below | Confirms continued downside. Seek short entry on pullback. |
| Psychological support | $4,400 | Cross below | Target 1 bearish reached. Take partials. |
| Yearly open support | $4,319 | Cross below | Target 2 bearish. Zone of possible Wyckoff Selling Climax. Seek longs with confirmation. |
| Bearish invalidation | $4,996 | Cross above | Bias completely invalidated. Structure recovered. |
Recommended condition: use “Close” (not “Touch”) to avoid false alerts with wicks in this volatility.
Summary by Numbers
| Metric | Value |
|---|---|
| Weekly close | $4,497 (Pepperstone) / $4,575 (GC=F) |
| Weekly low | $4,478 (Friday, Mar 20) |
| Weekly high | ~$5,017 (Monday, Mar 16) |
| Weekly decline | -10.4% ($520+) |
| Daily ATR | $200+ (extreme) |
| Expected range next week | $4,319 - $4,554 |
| Bias | Bearish (below $4,554) |
| Score | 3/10 |
| Active supports | $4,478 / $4,400 / $4,319 / $4,200 |
| Active resistances | $4,554 / $4,703 / $4,960 / $4,996 |
| Key event | Core PCE Friday, Mar 28 12:30 UTC |
| Recommended risk | 0.5% per trade (half normal) |
Conclusion
Gold closed the week at $4,497, destroying all previous supports ($4,960, $4,703, $4,554, $4,520). We are in an environment of extreme volatility where daily ATR exceeds $200. The next real supports are at $4,400 (psychological), $4,319 (yearly open), and $4,200 (200-EMA Daily).
The structure is clearly bearish on all timeframes. However, price is overstretched and a technical pullback toward the $4,520-$4,554 zone is likely before more downside. The key: don’t chase the move, wait for pullbacks to sell zones, and if you want to buy, only at strong supports ($4,319-$4,400) with confirmation.
Friday’s Core PCE will define whether the fall continues toward $4,200 or if we see a short squeeze toward $4,700.
We will update this analysis during the week if there are significant changes in structure or unexpected catalysts.
Glossary of Terms Used
| Term | Definition |
|---|---|
| BOS (Break of Structure) | Breaking a previous swing high or swing low that confirms trend continuation. A bearish BOS occurs when price breaks a previous low. |
| CHoCH (Change of Character) | First structural break in the direction opposite to the current trend. Signals a possible trend change. |
| Order Block (OB) | The last counter move candle before an institutional impulsive move. Represents a zone where institutions placed orders. Functions as high-probability support/resistance. |
| Fair Value Gap (FVG) | Price imbalance visible as a gap between 3 consecutive candles, where candle 1’s wick doesn’t overlap with candle 3’s wick. Price tends to return to fill these gaps. |
| Breaker Block | An Order Block that was invalidated (price moved through it). Instead of acting as support, it now acts as resistance, and vice versa. |
| Liquidity Sweep | Price movement that sweeps (touches and exceeds) a level where stop losses are accumulated (equal highs/lows, swing points), then reverses in the opposite direction. |
| Displacement | Aggressive, impulsive price movement with large-bodied candles and small wicks. Indicates institutional presence and usually leaves FVGs. |
| Killzone | Specific time windows where institutional activity is highest: Asian (21:00-03:00), London Open (04:00-05:00), NY Open (09:30-11:00). Times in UTC-3 Chile. |
| Premium / Discount | Zones relative to price range. Premium (above 50%) is expensive zone to sell. Discount (below 50%) is cheap zone to buy. |
| Equal Highs / Equal Lows | Two or more highs or lows at the same price level. Represent accumulated liquidity (stop losses) that institutions seek to sweep. |
| Market Structure | The sequence of Higher Highs/Higher Lows (bullish) or Lower Highs/Lower Lows (bearish) that defines the market trend. |
| LTF / HTF | Lower Time Frame (low timeframes: 1m, 5m, 15m) and Higher Time Frame (high timeframes: 1H, 4H, Daily). Analysis goes from HTF to LTF (top-down). |
| DXY | Dollar Index — measures dollar strength against a basket of currencies. Inverse correlation with Gold: DXY rises → Gold falls. |
| Core PCE | Personal Consumption Expenditures Core — Fed’s preferred inflation measure. Excludes food and energy. Most important macro data for Gold. |
| NFP | Non-Farm Payrolls — monthly US employment report (first Friday of each month). Strong data → USD rises → Gold falls. |
| FOMC | Federal Open Market Committee — Fed committee that sets interest rates. Its decisions and communications move Gold significantly. |
| Hawkish / Dovish | Hawkish: aggressive Fed tone, favors raising rates (negative for Gold). Dovish: relaxed tone, favors cutting rates (positive for Gold). |
| ATR | Average True Range — volatility indicator measuring average price movement. Used to estimate price ranges and calculate stop losses. |
| ORL | Opening Range Low — the minimum of the opening range for a period (daily, weekly, monthly). Functions as support/resistance level. |
| Fibonacci 61.8% | Most-used Fibonacci retracement level. Represents the “golden ratio” and often coincides with price reaction zones. |
| Margin call | When trader losses reach a level where broker requires additional capital deposit or forcibly liquidates positions. |
| MoM (Month over Month) | Percentage change of data versus previous month. Ex: if Core PCE comes in 0.4% MoM, prices rose 0.4% versus previous month. Used to measure short-term inflation. |
Disclaimer
Educational and informational content. This is not financial advice or a buy/sell recommendation. Trading involves risk of capital loss. Past results do not guarantee future results. Do your own research (DYOR).