XAU/USD SMC/ICT Analysis Today — Pre-London Setup (Apr 13)
XAU/USD at $4,707. 4H Structure BEARISH. Wyckoff: transition. 2 active setups. Score -8.
In summary
Gold down 0.9% and closed at $4,707. It was a day of moderate movement — the price moved $46 between its lowest point ($4,694) and highest ($4,740).
The trend is bearish (high confidence, score -8). Sellers dominate. If it doesn’t recover resistance, it’s likely to keep falling.
Why? Bond yields are rising (bad for gold); silver down 2.8% (sign of weakness in metals); the dollar is strengthening (pressures gold downward).
Technical analysis
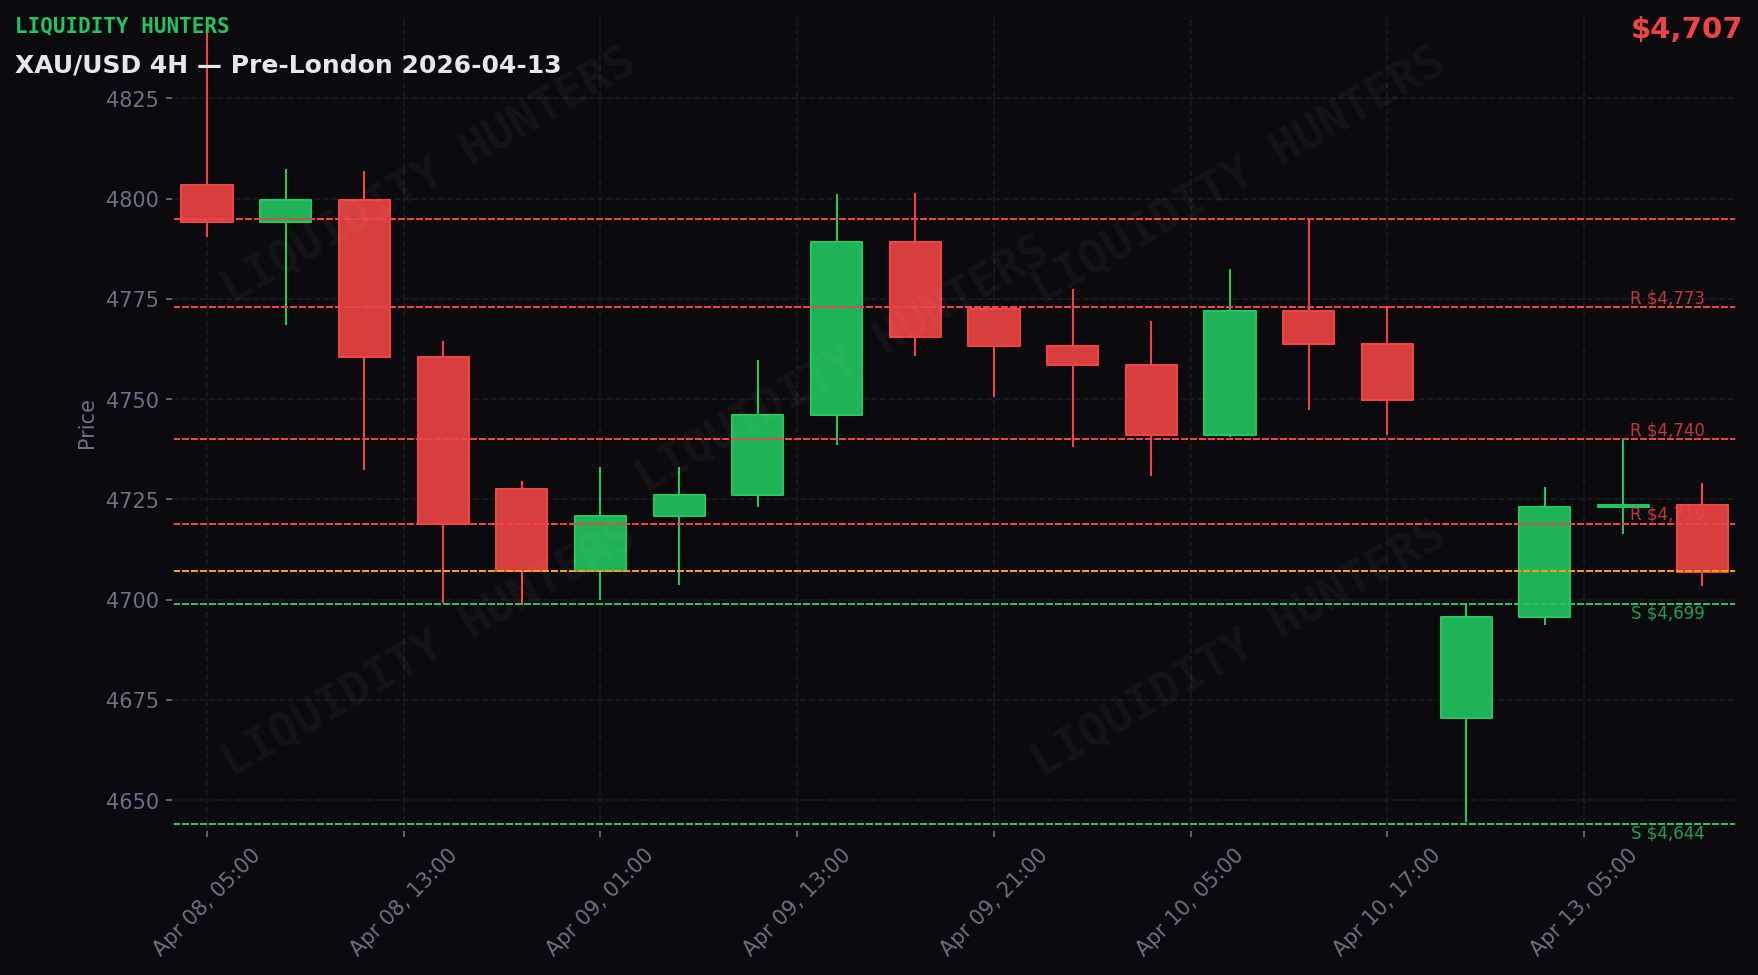
Gold closed on Mon 13 April at $4,707 (down 0.90%). Structure 4H: BEARISH. Wyckoff Ranging. Daily range: $46 ($4,694 - $4,740). Score: -8 BEARISH.
The day in detail
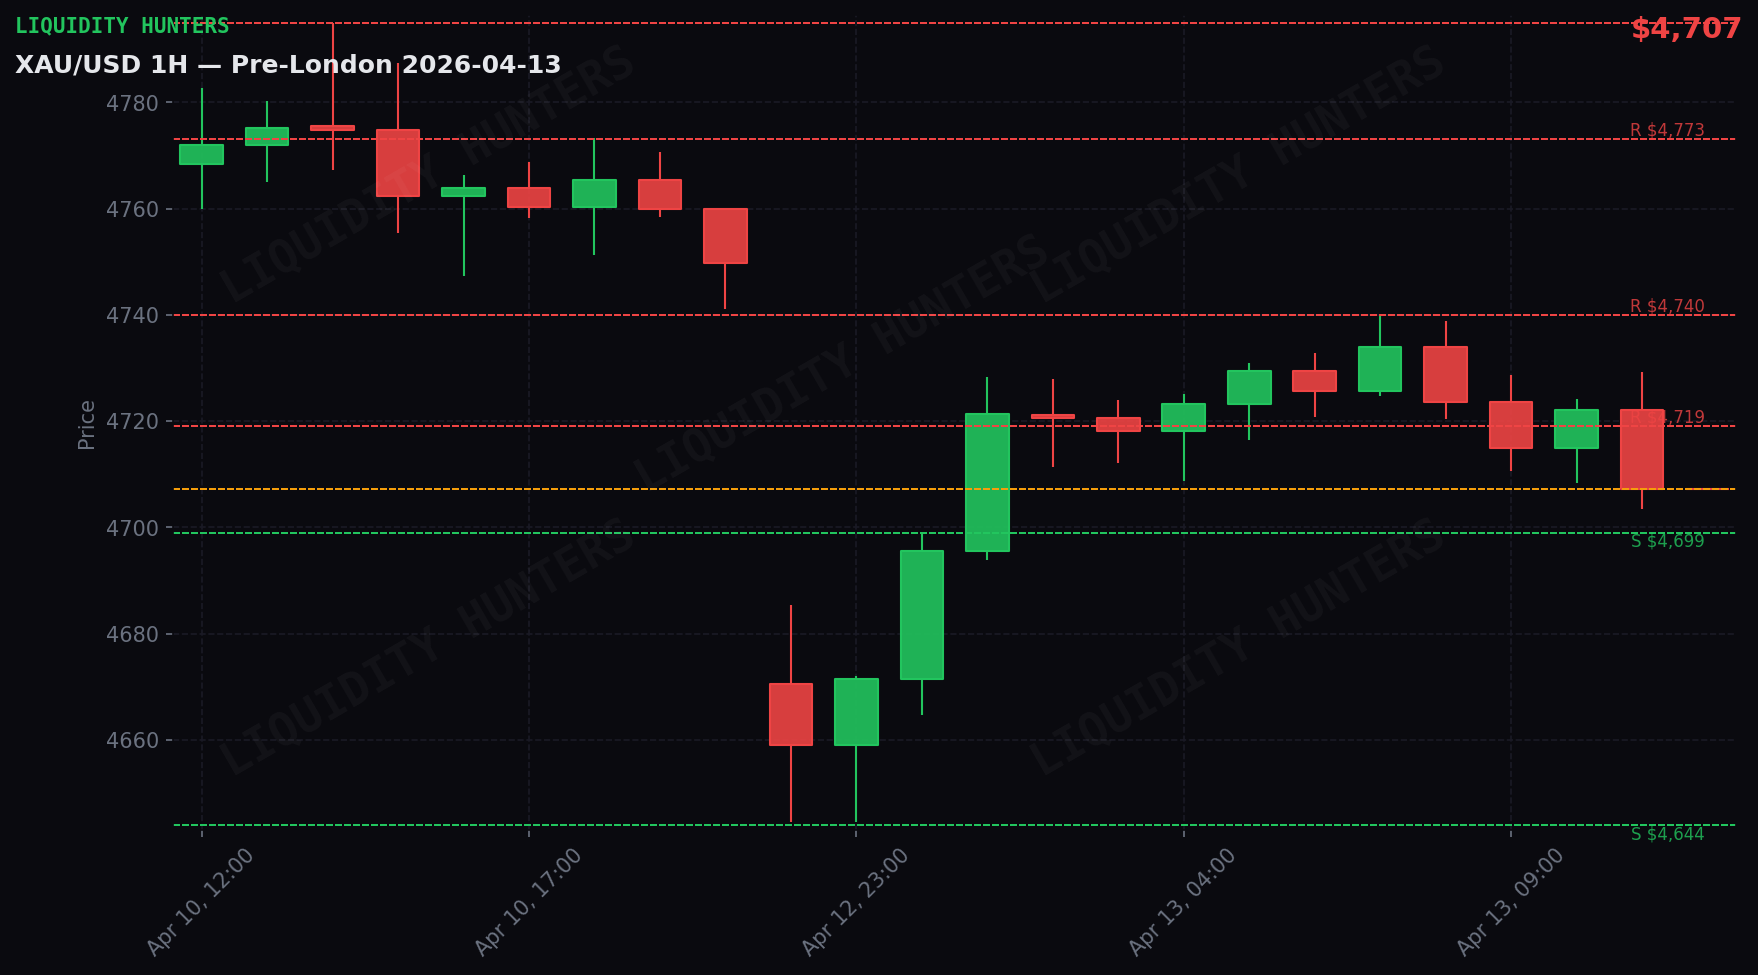
Act 1 — Asia (21:00-04:00 Chile): Gold rose $54 (1.2%), from $4,671 to $4,726. Moderate range of $39.
Act 2 — London (04:00-09:00 Chile): Gold fell $19 (0.4%), from $4,726 to $4,707. Moderate range of $37.
Correlations
DXY rising (+0.33%) — USD strength pressures Gold. The inverse correlation is active against us.
Silver -2.8% — negative. Widespread weakness in precious metals.
Yields rising (+0.93%) — pressure on Gold. Higher bond yields directly compete with gold.
Market Maker
Institutions are distributing on rallies. Upside breakouts are potential traps.
Trade setups
2 active setups. Entries, stops and targets below — all public. No trigger, no trade.
A. 🔴 SHORT — Support breakdown ⭐ Favorite
Entry: $4,699 · SL: $4,729 · TP1: $4,644 · R:R 1:1.8 · Risk: 0.5-0.75%
Trigger: Breakdown + retest of $4,699
Confirmations (all required):
- 1H candle closes BELOW $4,699 (real close, no wick)
- Retest: price returns to $4,699±5 and is rejected (1-3 5m candles)
- On retest: 5m candle with upper wick touches $4,699 and close stays below
- Breakdown volume > average (break candle with body >60%)
- Price does NOT return above $4,699 with 5m close after retest
Invalid if:
- 1H close back above $4,699 → false breakdown, cancel
- 5m close above $4,729 → setup dead
- If no retest within 3 1H candles post-breakdown → expired, don’t chase
B. 🟢 LONG — Resistance breakout
Entry: $4,719 · SL: $4,699 · TP1: $4,740 · R:R 1:1.1 · Risk: 0.5%
Trigger: Breakout + retest of $4,719
Confirmations (all required):
- 1H candle closes ABOVE $4,719 (no wicks — real close only)
- Retest: price returns to $4,719±5 and bounces (1-3 5m candles)
- On retest: 5m candle with lower wick touches $4,719 and close stays above
- Breakout volume > average (break candle should not be doji or inside bar)
- Price does NOT return below $4,719 with 5m close after retest
Invalid if:
- 1H close back below $4,719 → false breakout, cancel
- 5m close below $4,699 → setup dead
- If no retest within 3 1H candles post-breakout → expired, don’t chase
Scenarios
Scenario 1 — Retracement to resistance and rejection (50%): Gold rises to nearby resistance and is rejected. Sellers defend resistance. Continuation bearish toward support zone.
Scenario 2 — Consolidation in range (30%): Gold stays between nearby support-resistance without direction. Await catalyst.
Scenario 3 — Upside breakout (20%): Gold breaks nearby resistance with 1H close above. Bias change. Cancel shorts.
What to do
2 active setups. Favorite: SHORT Support breakdown.
The key resistance is the level to watch. If it rejects, continuation bearish. If it breaks with 1H close, cancel shorts.
Analysis generated by the Liquidity Hunters team. This analysis is educational and is not financial advice. Trading carries the risk of capital loss.
Replay this day bar by bar in the simulator
Trade the same scenario risk-free: the replay starts on this date and the analysis levels activate on their own as you advance. When you close, the AI scores your decisions.
Open in the simulatorDisclaimer
Educational and informational content. This is not financial advice or a buy/sell recommendation. Trading involves risk of capital loss. Past results do not guarantee future results. Do your own research (DYOR).