XAU/USD SMC/ICT Analysis — 21 September 2026 | Pre-NY Killzone
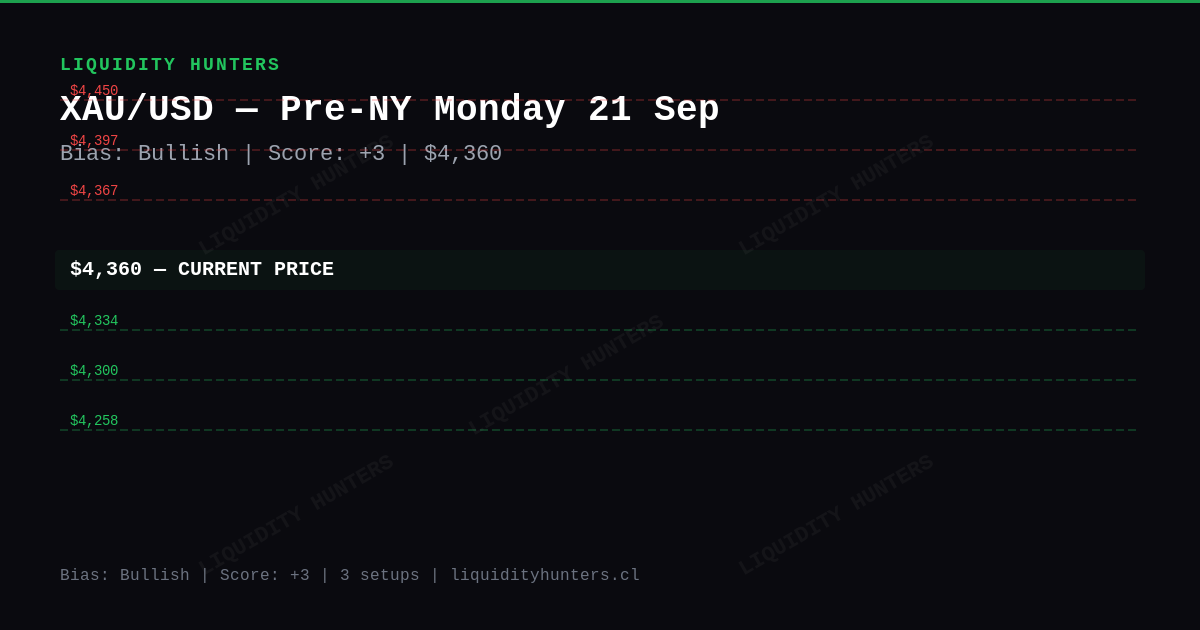
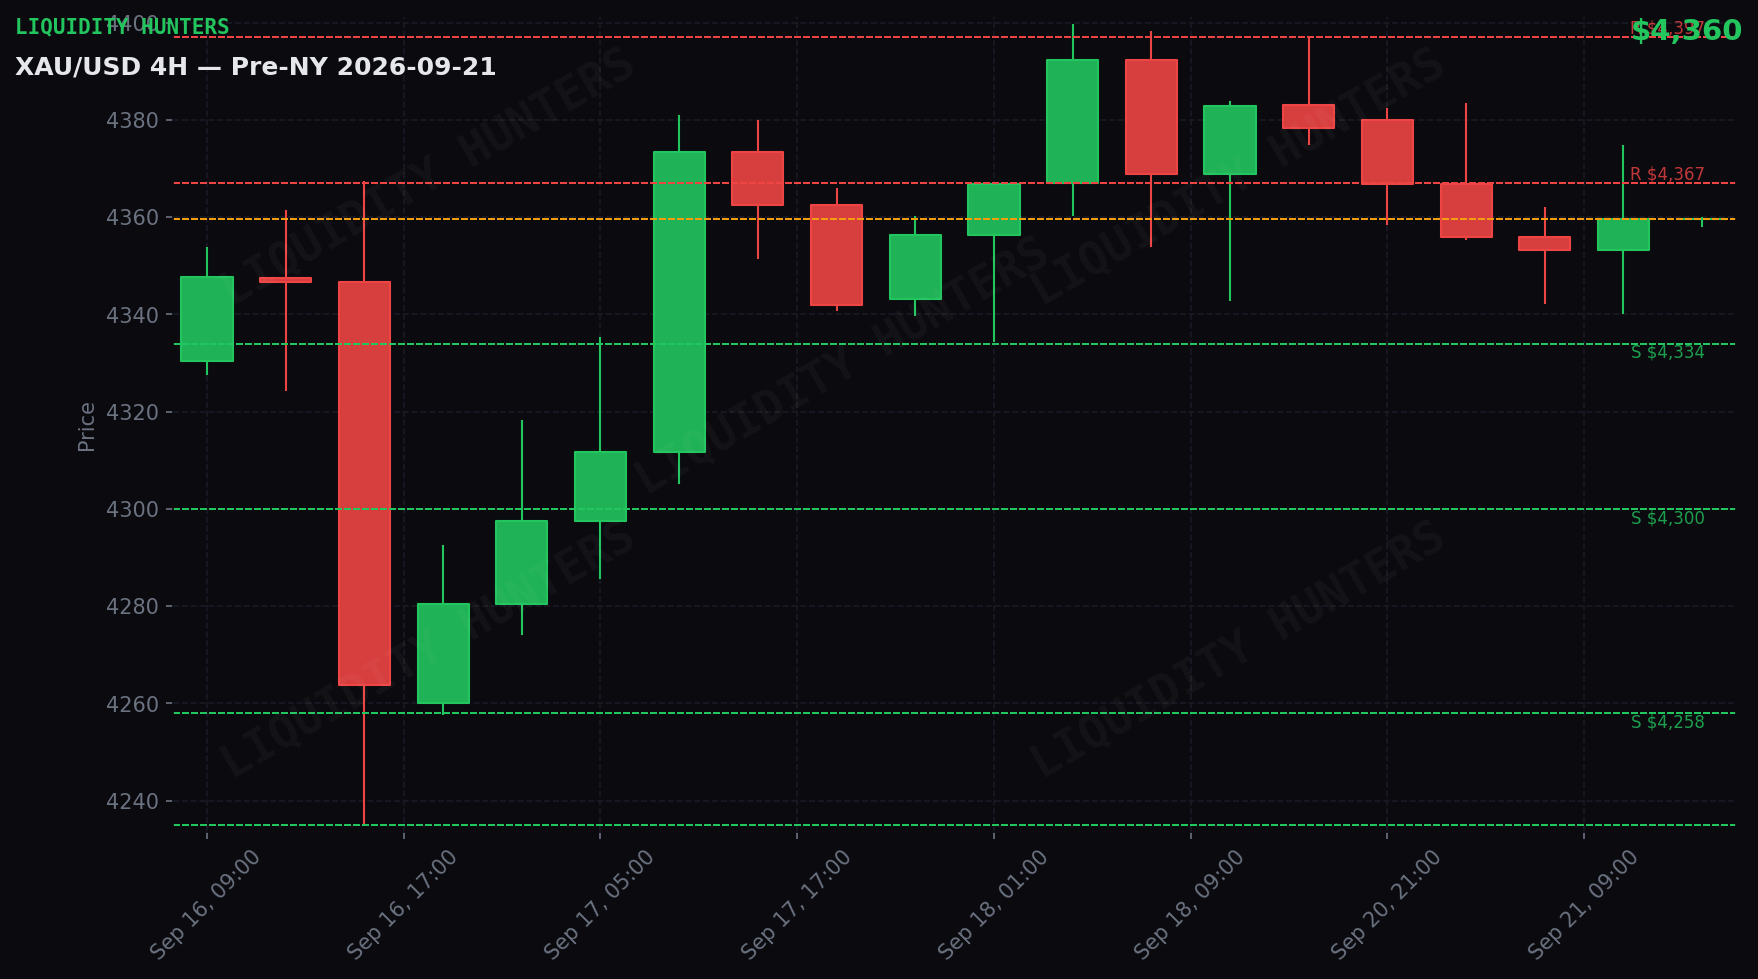
Key levels: R $4,367 / S $4,334. Pre-NY, September 21, XAU/USD bullish bias score +3. SMC/ICT Order Blocks visible. Full analysis in charts.
Frequently Asked Questions
What is the bias for XAU/USD in today's Pre-NY session?
XAU/USD shows a bullish bias with score +3/10. The Wyckoff phase is transition. Trade with the structural direction. Current price is $4,360.
What are the key resistance and support levels for XAU/USD today?
Immediate resistance is at $4,367. Key support is $4,334. Upper resistance extends toward $4,500. Deeper liquidity pool near $4,235. Watch for reaction at each level for SMC/ICT confirmations.
What is the main long setup for XAU/USD in the Pre-NY killzone?
Main setup: LONG — Pullback to support. Entry $4,334, SL $4,300, TP1 $4,367 (1:1.0). Trigger: Bullish CHoCH on 5m in $4,334±5 zone. Adjust sizing to your own risk management per trade.
Where is the invalidation level for XAU/USD's bias today?
The bullish bias is invalidated by a clean 1H close above $4,500 or below $4,235. Until then, trade with the structure. Avoid entries against trend without a CHoCH confirmation on M15 or higher.
What macro drivers are affecting XAU/USD today?
**DXY flat (+0.04%)** — no significant direct pressure. **Yields falling (-0.60%)** — positive for Gold. Lower bond yields favor non-yielding assets like gold.
In summary
Gold fell 0.4% and closed at $4,360. It was a calm day — the price moved $38 between its low ($4,340) and high ($4,378).
The trend is bullish (high conviction, score +3). Institutions are buying on pullbacks. If price holds above key support, more upside likely in the coming sessions.
Why? Bond yields are falling (good for gold — gold competes with bonds).
Watch Friday: the Fed’s preferred inflation indicator releases (2026-09-25 09:30 Chile). A low print drives strong gold upside; a high print can crush it. It’s the most important data of the week.
Technical analysis
Gold closed Monday, September 21 at $4,360 (down 0.43%). 4H structure: ACCUMULATION. Wyckoff Ranging. Daily range: $38 ($4,340 - $4,378). Score: +3 Bullish.
The day in detail
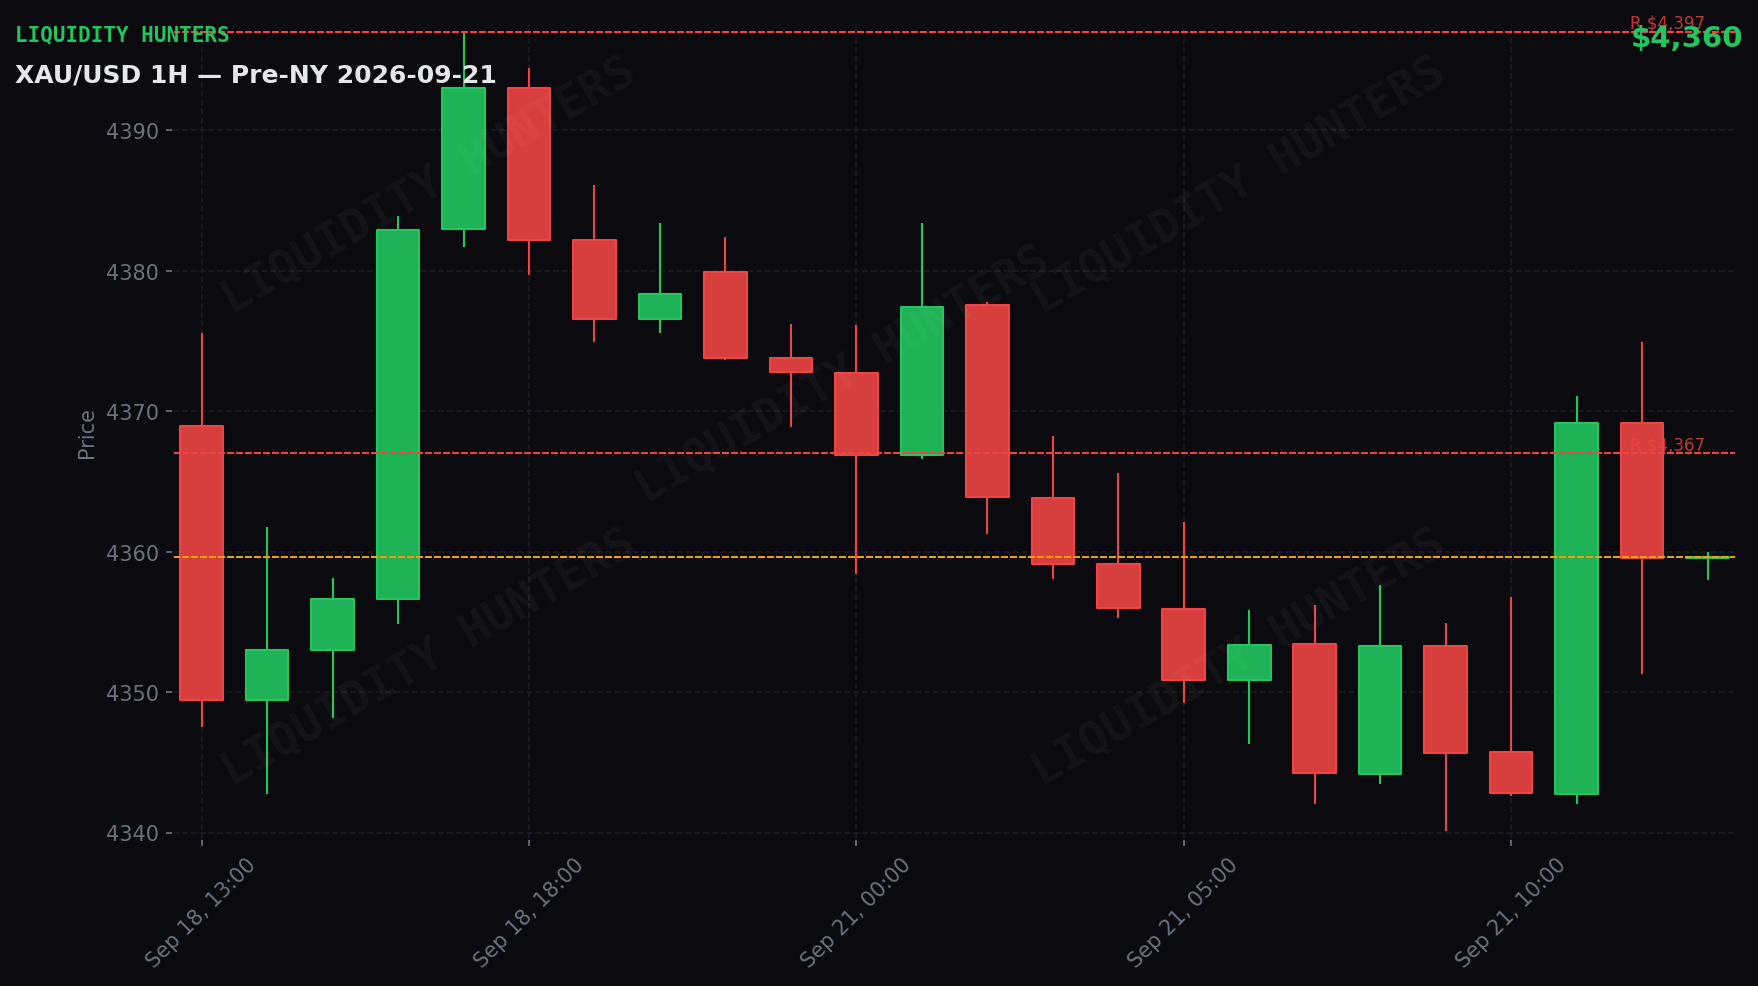
Act 1 — Asia (21:00-04:00 Chile): Gold fell $19 (0.4%), from $4,373 to $4,353. Moderate range of $32.
Act 2 — London (04:00-09:00 Chile): Gold rose $16 (0.4%), from $4,353 to $4,369. Moderate range of $31.
Act 3 — NY (09:00-16:00 Chile): Gold fell $10 (0.2%), from $4,369 to $4,360. Moderate range of $24. NY reversed 61% of London’s rally — normal pullback.
Correlations
DXY flat (+0.04%) — no direct pressure.
Yields falling (-0.60%) — positive for Gold. Lower bond yields favor non-yielding assets like gold.
Market Maker
BSL (short stops above): $4,378, $4,375, $4,371 SSL (long stops below): $4,340, $4,342, $4,343
Price near BSL $4,367. The MM could sweep stops above and continue higher. The second touch often breaks.
Trade setups
3 active setups. Entries, stops, and targets below — all public. One trade; the favorite is marked. No trigger, no trade.
A. 🟢 LONG — Pullback to support ⭐ Favorite
Entry: $4,334 · SL: $4,300 · TP1: $4,367 · R:R 1:1.0 · Risk: 0.75-1%
Trigger: CHoCH bullish on 5m in $4,334±5 zone
Confirmations (all mandatory):
- Price falls to $4,334±5 zone (don’t enter early)
- Bullish CHoCH on 5m: a higher high breaks the last swing high
- Confirmation candle on 5m: body >60% of range, close in the upper third
- Displacement: impulse candle with body >70% and lower wick <20%
- $4,334 zone does NOT breach with a 5m close below
Invalid if:
- 5m close below $4,300 → setup dead
- 3 consecutive 5m candles below $4,334 without recovery → cancel
- If 2 hours pass without trigger → expired (wait for new analysis)
B. 🟢 LONG — Resistance breakout
Entry: $4,367 · SL: $4,334 · TP1: $4,397 · R:R 1:0.9 · Risk: 0.5-0.75%
Trigger: Breakout + retest of $4,367
Confirmations (all mandatory):
- 1H candle closes ABOVE $4,367 (real close, not a wick)
- Retest: price returns to $4,367±5 and bounces (1-3 5m candles)
- On retest: 5m candle with lower wick touches $4,367 and close holds above
- Breakout volume > average (breakout candle should not be a doji or inside bar)
- Price does NOT return below $4,367 with a 5m close after retest
Invalid if:
- 1H close back below $4,367 → false breakout, cancel
- 5m close below $4,334 → setup dead
- If no retest within 3 1H candles after breakout → expired, don’t chase
C. 🔴 SHORT — Support breakdown
Entry: $4,334 · SL: $4,364 · TP1: $4,300 · R:R 1:1.1 · Risk: 0.5%
Trigger: Breakdown + retest of $4,334
Confirmations (all mandatory):
- 1H candle closes BELOW $4,334 (real close, not a wick)
- Retest: price returns to $4,334±5 and is rejected (1-3 5m candles)
- On retest: 5m candle with upper wick touches $4,334 and close holds below
- Breakdown volume > average (break candle with body >60%)
- Price does NOT return above $4,334 with a 5m close after retest
Invalid if:
- 1H close back above $4,334 → false breakdown, cancel
- 5m close above $4,364 → setup dead
- If no retest within 3 1H candles after breakdown → expired, don’t chase
Counter-trend setup. Confidence MEDIUM. Counter-trend at weak level — confirmation required only
Scenarios
Scenario 1 — Healthy pullback and continuation (50%): Gold retraces to the support zone-$4,340 and bounces. Buyers defend support. Continuation toward the nearest resistance.
Scenario 2 — Range consolidation (30%): Gold holds between the support zone-nearest resistance with no clear direction. Volume declines.
Scenario 3 — Support breakdown (20%): Gold breaks the support zone with a 1H close below. Move back to $4,300. Cancel longs.
What to do
3 active setups — see the Trade setups section above for full entries, stops, targets, and triggers. Favorite: LONG Pullback to support at $4,334.
Key support: $4,334. If it holds, bullish continuation. If it breaks on a 1H close, cancel the longs.
Critical event: Core PCE Price Index (Aug data) — 2026-09-25 09:30 Chile. Reduce exposure before release.
Analysis generated by Liquidity Hunters team. This is educational content and not financial advice. Trading involves risk of capital loss.
Replay this day bar by bar in the simulator
Trade the same scenario risk-free: the replay starts on this date and the analysis levels activate on their own as you advance. When you close, the AI scores your decisions.
Open in the simulatorDisclaimer
Educational and informational content. This is not financial advice or a buy/sell recommendation. Trading involves risk of capital loss. Past results do not guarantee future results. Do your own research (DYOR).