XAU/USD SMC/ICT Analysis — 26 May 2026 | Pre-London Killzone
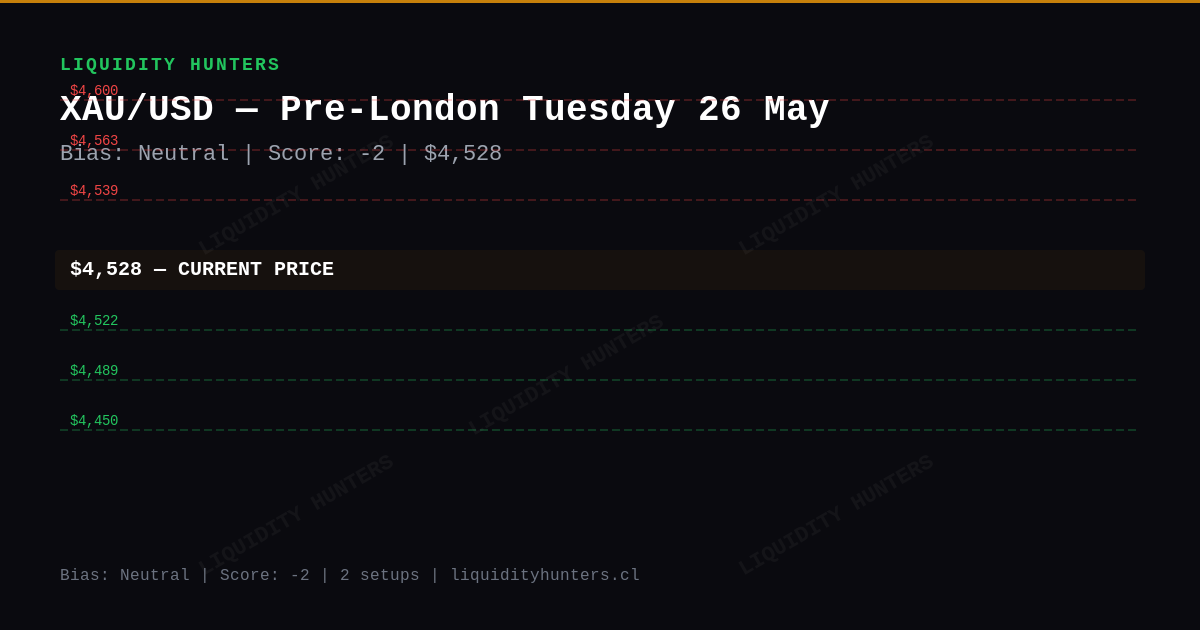
Key levels: R $4,539 / S $4,522. XAU/USD SMC/ICT analysis for Pre-London session, May 2026. Bias Neutral, score -2. Gold at $4,528 as bond yields fall sharply.
Frequently Asked Questions
What is the XAU/USD bias for the Pre-London session today?
XAU/USD shows a neutral bias with score -2/10. Wyckoff phase is transition. Trade with the structural direction. Current price sits at $4,528.
What are the key resistance and support levels for XAU/USD today?
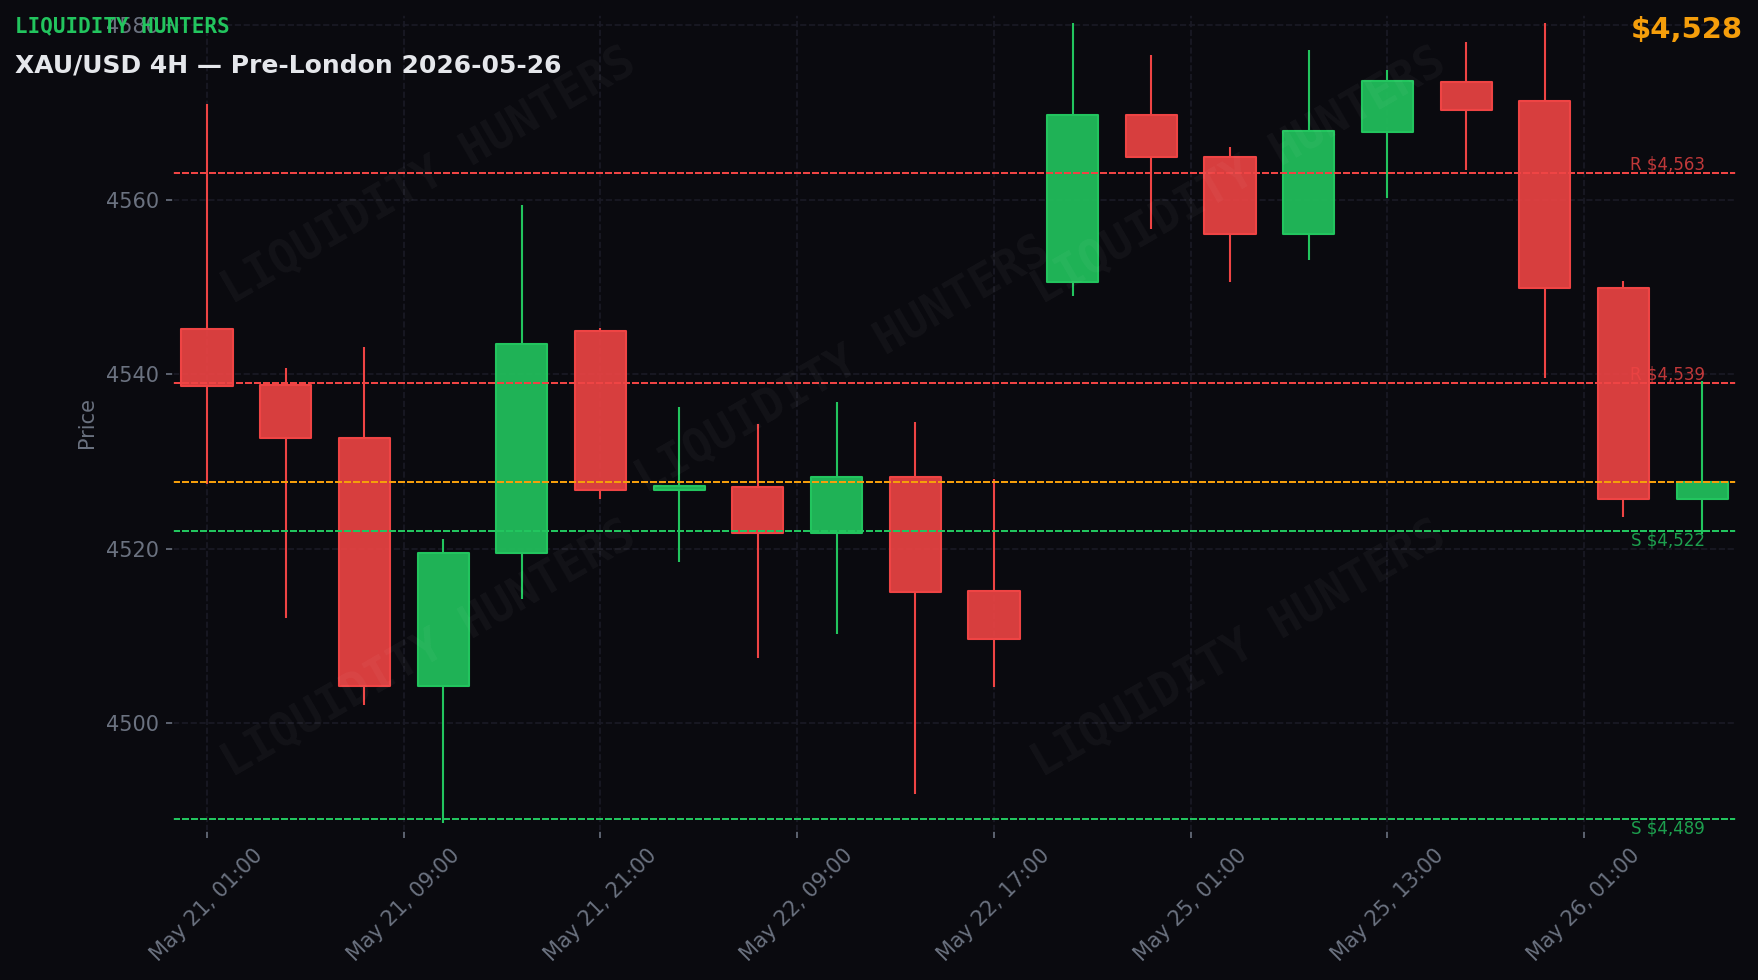
Immediate resistance sits at $4,539. Key support is $4,522. Higher resistance extends toward $4,650. Deeper liquidity pool near $4,400. Watch for reaction at each level for SMC/ICT confirmations.
What is the main XAU/USD long setup for the Pre-London killzone?
Main setup: LONG — Resistance breakout. Entry $4,539, SL $4,522, TP1 $4,563 (1:1.4). Trigger: Breakout + retest of $4,539. Adjust sizing to your own per-trade risk management.
Where is the invalidation level for today's XAU/USD bias?
The neutral bias invalidates on a clean 1H close above $4,650 or below $4,400. Until then, trade with the structure. Avoid counter-trend entries without a CHoCH confirmation on M15 or higher.
What macro drivers are affecting XAU/USD today?
**DXY neutral (+0.06%)** — no significant direct pressure. **Silver +1.1%** — positive. Precious metals moving in sync. **Yields falling (-1.10%)** — positive for Gold. Lower bond yields favor non-yielding assets like gold.
In summary
Gold fell 0.9% and closed at $4,528. It was a moderately active day — price swung $59 between its low ($4,522) and high ($4,580).
The market is undecided (score -2). Price is oscillating in a range with no clear direction. Better to wait for definition.
Why? bond yields are falling (good for gold — gold competes with bonds); silver climbed 1.1% (when silver rallies hard, gold tends to follow).
Next important event: FOMC Meeting Minutes (2026-05-27 15:00 Chile). Volatility likely.
Technical analysis
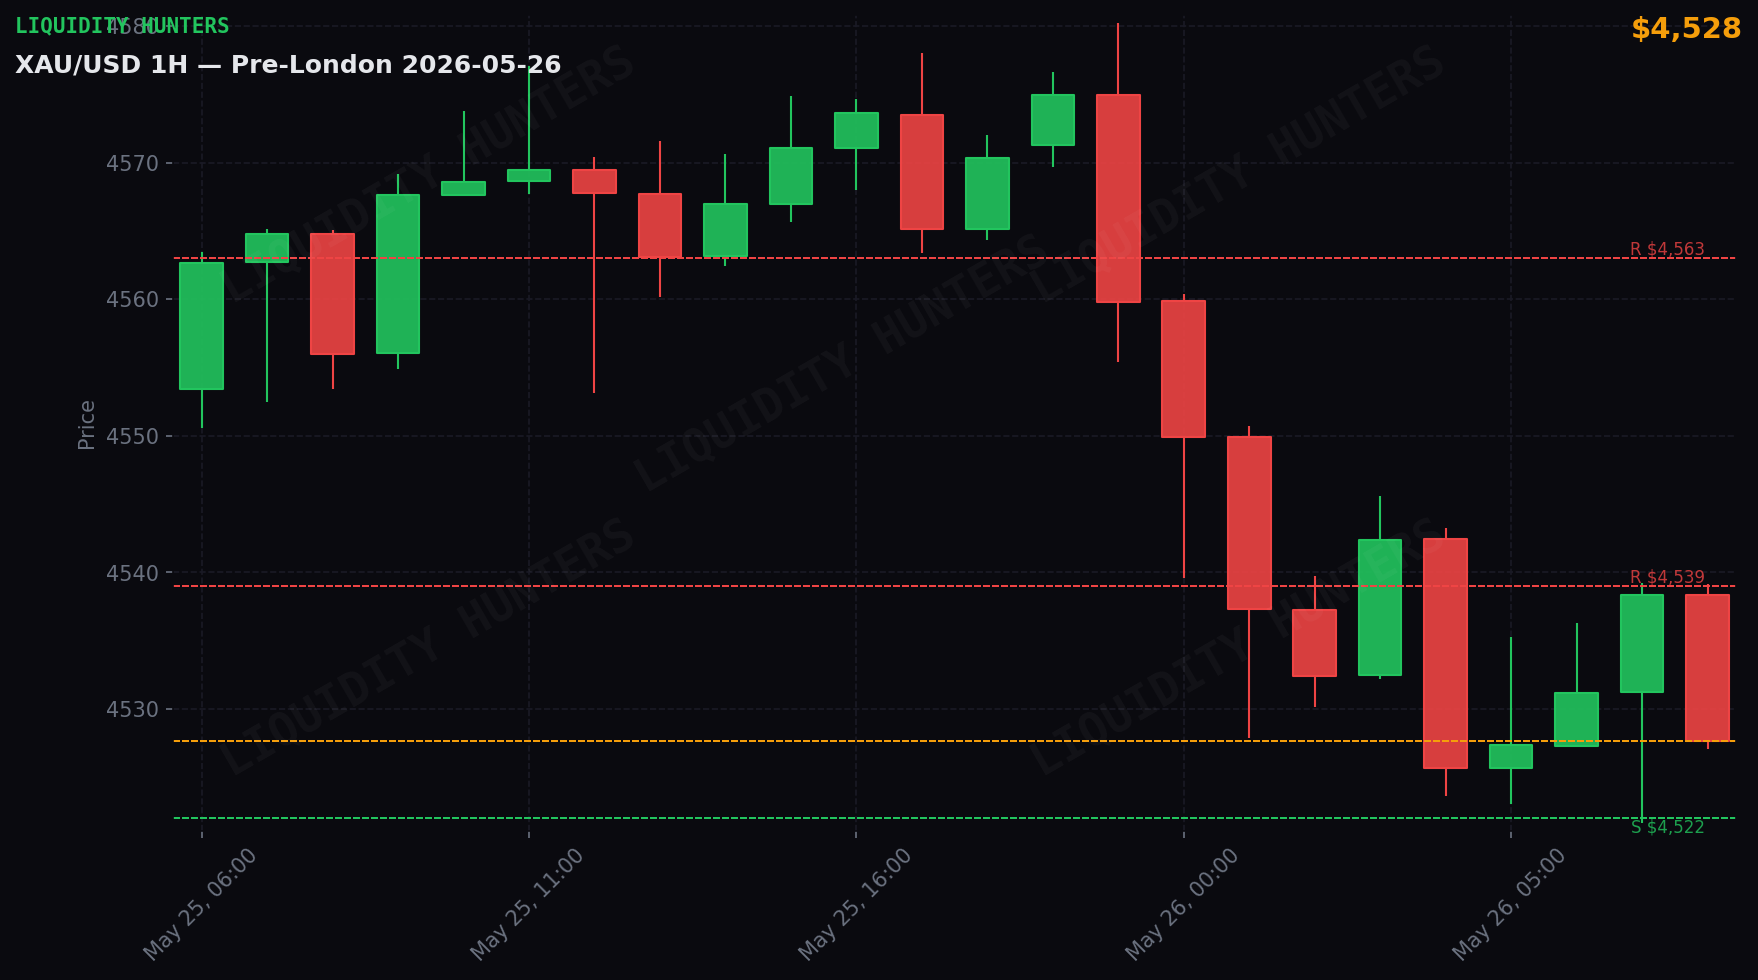
Gold closed Tuesday May 26 at $4,528 (fell 0.93%). 4H structure: BEARISH. Wyckoff Ranging. Daily range: $59 ($4,522 - $4,580). Score: -2 Neutral.
The day in detail
Act 1 — Asia (21:00-04:00 Chile): Gold dropped $29 (0.6%), from $4,560 to $4,531. Moderate range of $37.
Act 2 — London (04:00-09:00 Chile): Quiet session. Gold moved only $18 ($4,522-$4,539). No relevant moves.
Correlations
DXY neutral (+0.06%) — no significant direct pressure.
Silver +1.1% — positive. Precious metals moving in sync.
Yields falling (-1.10%) — positive for Gold. Lower bond yields favor non-yielding assets like gold.
Market Maker
BSL (stops of shorts above): $4,580, $4,577, $4,572 SSL (stops of longs below): $4,522, $4,523, $4,524
Price near SSL $4,522. MM may sweep stops below and bounce. Bearish trap likely.
Trade setups
2 active setups. Entries, stops and targets below — all public. One trade only; the favorite is marked. No trigger, no trade.
A. 🟢 LONG — Resistance breakout ⭐ Favorite
Entry: $4,539 · SL: $4,522 · TP1: $4,563 · R:R 1:1.4 · Risk: 0.5%
Trigger: Breakout + retest of $4,539
Confirmations (all required):
- 1H candle closes ABOVE $4,539 (real close, not a wick)
- Retest: price returns to $4,539±5 and bounces (1-3 5m candles)
- At the retest: 5m candle with lower wick touches $4,539 and close stays above
- Breakout volume > average (breakout candle must not be a doji or inside bar)
- Price does NOT return below $4,539 with a 5m close after the retest
Invalid if:
- 1H close back below $4,539 → fake breakout, cancel
- 5m close below $4,522 → setup dead
- If no retest within 3 1H candles post-breakout → expired, do not chase
Counter-trend setup. Confidence BAJA. Contratendencia justificado: nivel con score 4/5 (testeado 4+ veces)
B. 🔴 SHORT — Support breakdown
Entry: $4,522 · SL: $4,552 · TP1: $4,489 · R:R 1:1.1 · Risk: 0.5-0.75%
Trigger: Breakdown + retest of $4,522
Confirmations (all required):
- 1H candle closes BELOW $4,522 (real close, not a wick)
- Retest: price returns to $4,522±5 and is rejected (1-3 5m candles)
- At the retest: 5m candle with upper wick touches $4,522 and close stays below
- Breakdown volume > average (break candle with body >60%)
- Price does NOT return above $4,522 with a 5m close after the retest
Invalid if:
- 1H close back above $4,522 → fake breakdown, cancel
- 5m close above $4,552 → setup dead
- If no retest within 3 1H candles post-breakdown → expired, do not chase
Scenarios
Scenario 1 — Upside breakout (40%): Gold breaks nearest resistance and continues. Bias flips bullish.
Scenario 2 — Range (40%): Gold oscillates between support zone and nearest resistance. Trade the extremes.
Scenario 3 — Downside break (20%): Gold loses support zone. Bearish continuation.
What to do
2 active setups — see Trade setups section above for full entries, stops, targets and triggers. Favorite: LONG Resistance breakout at $4,539.
The market is in a range between $4,522 and $4,539. Trade the extremes with confirmation. Wait for a clean breakout to define bias.
Critical event: FOMC Meeting Minutes — 2026-05-27 15:00 Chile. Reduce exposure before the release.
Analysis generated by the Liquidity Hunters team. This is educational content and not financial advice. Trading involves risk of capital loss.
What the team says
Of 8 analysts, 1 agree and 7 have observations. There’s internal debate on this read.
Tu decides. Nosotros mostramos los datos y los desacuerdos. La decision final siempre es tuya.
Replay this day bar by bar in the simulator
Trade the same scenario risk-free: the replay starts on this date and the analysis levels activate on their own as you advance. When you close, the AI scores your decisions.
Open in the simulatorDisclaimer
Educational and informational content. This is not financial advice or a buy/sell recommendation. Trading involves risk of capital loss. Past results do not guarantee future results. Do your own research (DYOR).