XAU/USD Pre-Asia Analysis Sunday March 29 - Gold at $4,451, Bearish Bias
XAU/USD at $4,451. 4H BEARISH Structure. Wyckoff: accumulation. 2 active setups. Score -3.

Summary
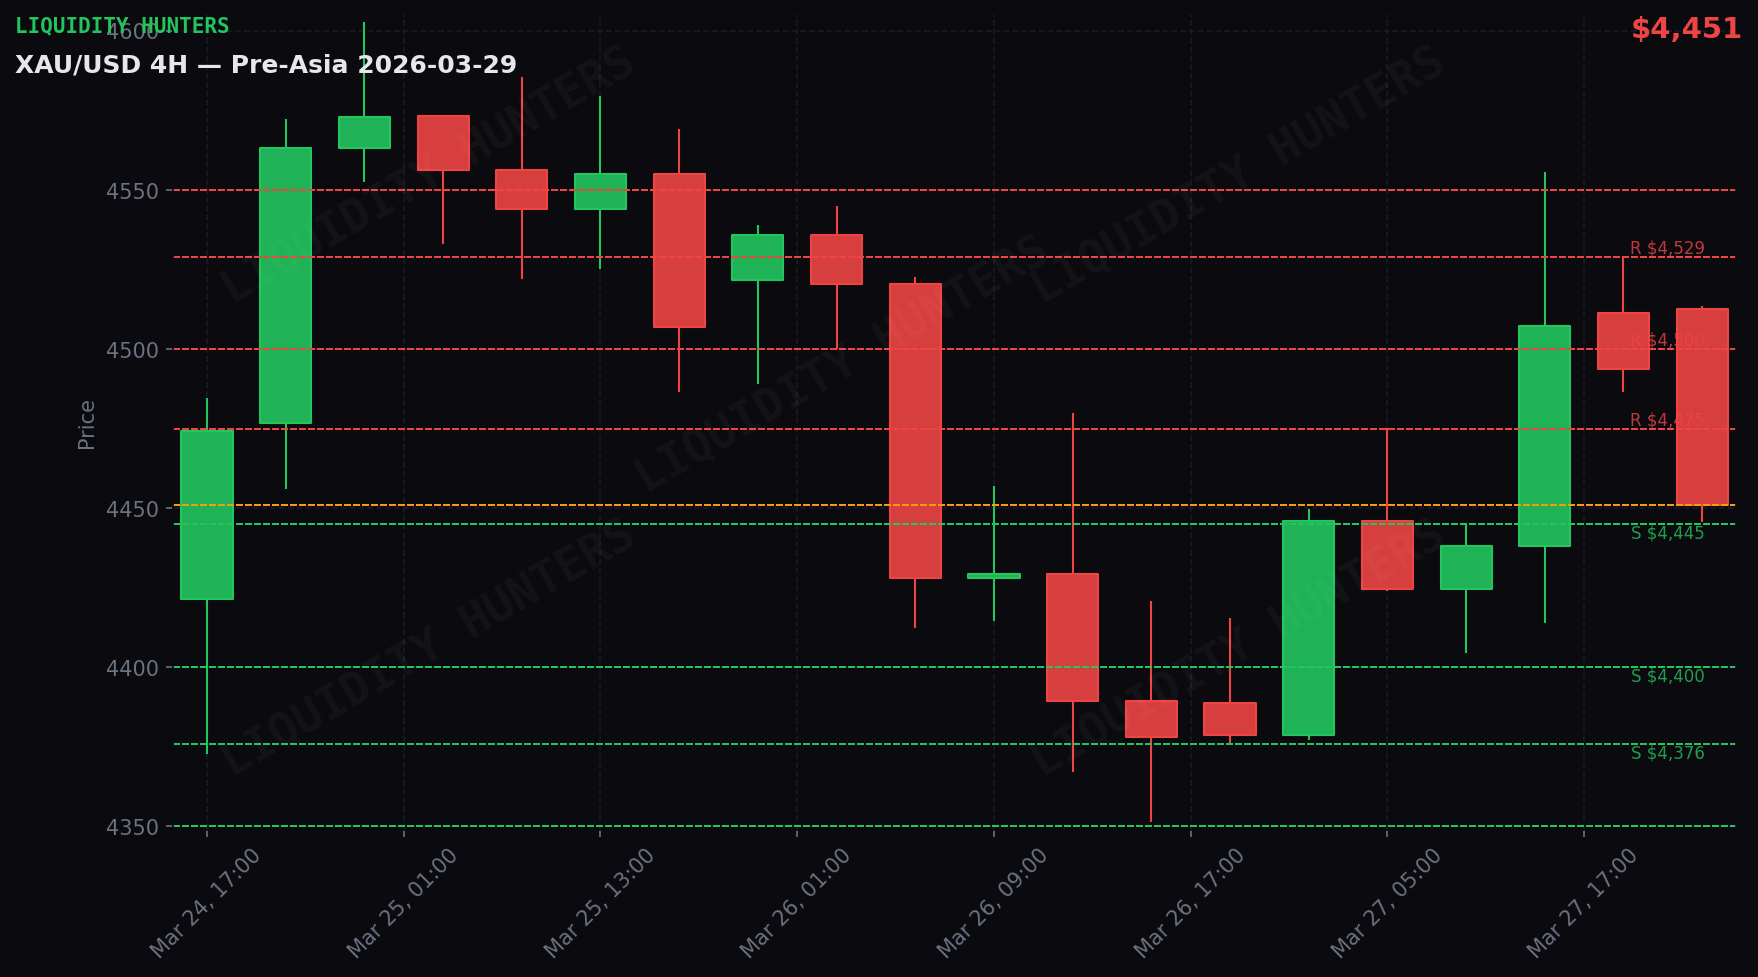
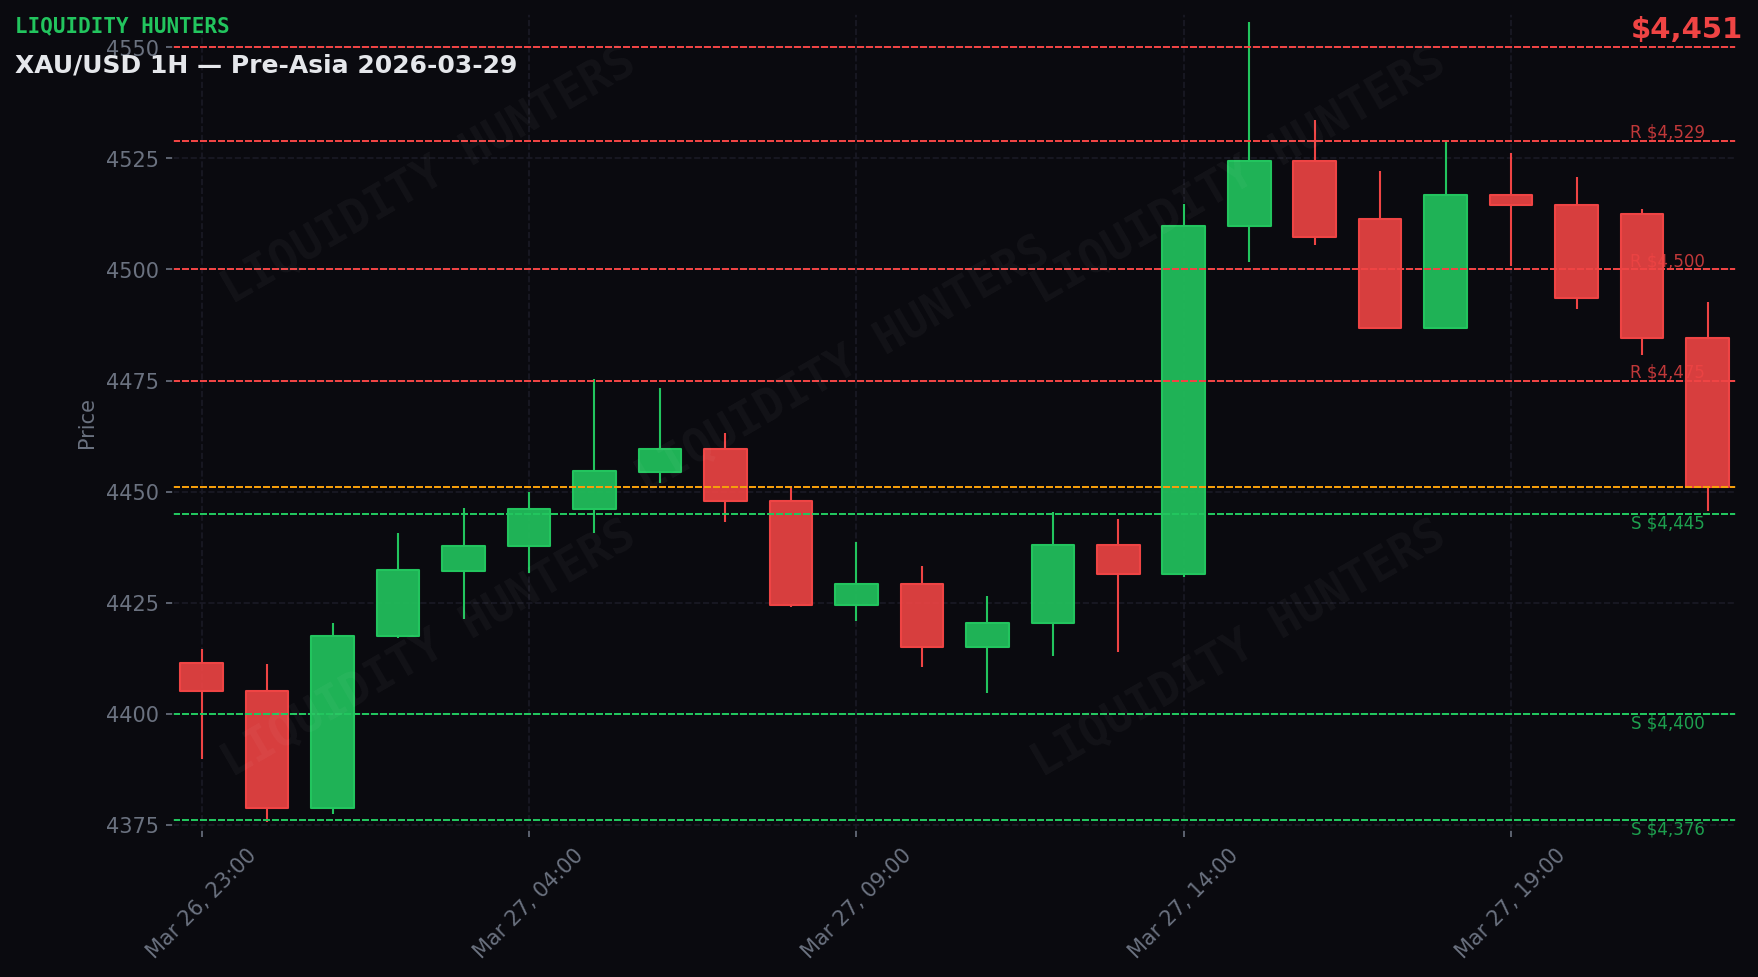
Gold dropped 0.9% and closed at $4,451. It was a volatile day — the price moved $151 between its low ($4,405) and high ($4,556).
The trend is bearish (high confidence, score -3). Sellers are in control. If it fails to recover resistance, further downside is likely.
Why? Bond yields are rising (negative for gold); silver dropped 2.3% (signal of weakness in precious metals).
The market just experienced a sharp decline (capitulation). There’s still considerable uncertainty. It’s time to observe, not to act aggressively.
Technical Analysis
Gold closed on Sunday, March 29 at $4,451 (down 0.95%). 4H structure: BEARISH. Wyckoff Phase A (SC). Daily range: $151 ($4,405 - $4,556). Score: -3 BEARISH.
The Day in Detail
Act 1 — Asia (21:00-04:00 Chile): Strong upward movement. Gold rose $54 from $4,405 to $4,460. Range of $71 with high at $4,475. The 01:00 UTC candle was the largest ($43 range).
Act 2 — London (04:00-09:00 Chile): Downward pressure. Gold fell $39 from $4,460 to $4,420. Range of $59 with low at $4,405. The 08:00 UTC candle was the largest ($27 range).
Act 3 — NY (09:00-16:00 Chile): Strong upward movement. Gold rose $96 from $4,420 to $4,517. Range of $143 with high at $4,556. The 14:00 UTC candle was the largest ($84 range).
Act 4 — Close (16:00-21:00 Chile): Downward pressure. Gold fell $61 from $4,513 to $4,451. Range of $68 with low at $4,446. The 23:00 UTC candle was the largest ($47 range).
Wyckoff: ACCUMULATION — Phase A (SC)
Selling Climax detected at $4,478. Waiting for Automatic Rally and Secondary Test.
The Selling Climax at $4,478 marked the capitulation point. We’re in the early accumulation phase. Waiting for Automatic Rally and Secondary Test. Volatility is extreme — reduce size.
Wyckoff Levels:
| Level | Price |
|---|---|
| SC | $4,478 |
| range_high | $5,602 |
| range_low | $3,886 |
Volatility HIGH
Daily ATR $179 vs normal $139 (1.3x). Moves are faster and sweeps more aggressive. SL adjusted x1.25, risk reduced.
Correlations
DXY neutral (+0.14%) — no direct significant pressure.
Silver -2.3% — negative. Broad weakness in precious metals.
Market Maker
Institutions are distributing on rallies. Upside breakouts are potential traps.
Trade setups
2 active setups. Entries, stops and targets below — all public. No trigger, no trade.
A. 🔴 SHORT — Pullback to resistance ⭐ Favorite
Entry: $4,475 · SL: $4,512 · TP1: $4,438 · R:R 1:1.0 · Risk: 0.8%
Trigger: Bearish rejection at $4,475
Confirmations (all required):
- Price rises to $4,475±5 zone (don’t short during the fall)
- Bearish CHoCH on 5m: lower low breaks last swing low
- 5m rejection candle: upper wick >60% of total range (pin bar or shooting star)
- Bearish displacement: red candle with body >70%, close in lower third
- The $4,475 resistance was NOT broken with 5m close above
Invalid if:
- 5m close above $4,505 → setup dead
- 1H close above $4,475 → resistance broken, cancel short
- If 2 hours pass without trigger → expired
B. 🔴 SHORT — Support breakdown
Entry: $4,445 · SL: $4,482 · TP1: $4,389 · R:R 1:1.5 · Risk: 0.6%
Trigger: Breakdown + retest of $4,445
Confirmations (all required):
- 1H candle closes BELOW $4,445 (real close, no wick)
- Retest: price returns to $4,445±5 and is rejected (1-3 5m candles)
- On the retest: 5m candle with upper wick touches $4,445 and close stays below
- Breakdown volume > average (breakout candle with body >60%)
- Price does NOT return above $4,445 with 5m close after retest
Invalid if:
- 1H close back above $4,445 → false breakdown, cancel
- 5m close above $4,475 → setup dead
- If no retest in 3 1H candles post-breakdown → expired, don’t chase
Scenarios
Scenario 1 — Pullback to Resistance and Rejection (50%): Gold rises to the next resistance and is rejected. Sellers defend resistance. Bearish continuation toward support zone.
Scenario 2 — Range Consolidation (30%): Gold stays between the next support-resistance zone with no direction. Await catalyst.
Scenario 3 — Upside Breakout (20%): Gold breaks next resistance with 1H close above. Change of bias. Cancel shorts.
What to Do
2 active setups. Favorite: SHORT Pullback to Resistance.
The key resistance is the level to watch. If rejected, bearish continuation. If it breaks with 1H close, cancel shorts.
Wyckoff Phase A (SC): extreme volatility. Reduce size. Wait for the range to define.
Analysis generated by the Liquidity Hunters team. This analysis is educational and is not financial advice. Trading carries the risk of capital loss.
Replay this day bar by bar in the simulator
Trade the same scenario risk-free: the replay starts on this date and the analysis levels activate on their own as you advance. When you close, the AI scores your decisions.
Open in the simulatorDisclaimer
Educational and informational content. This is not financial advice or a buy/sell recommendation. Trading involves risk of capital loss. Past results do not guarantee future results. Do your own research (DYOR).