XAU/USD SMC/ICT Analysis Today — Pre-Asia Setup (Apr 20)
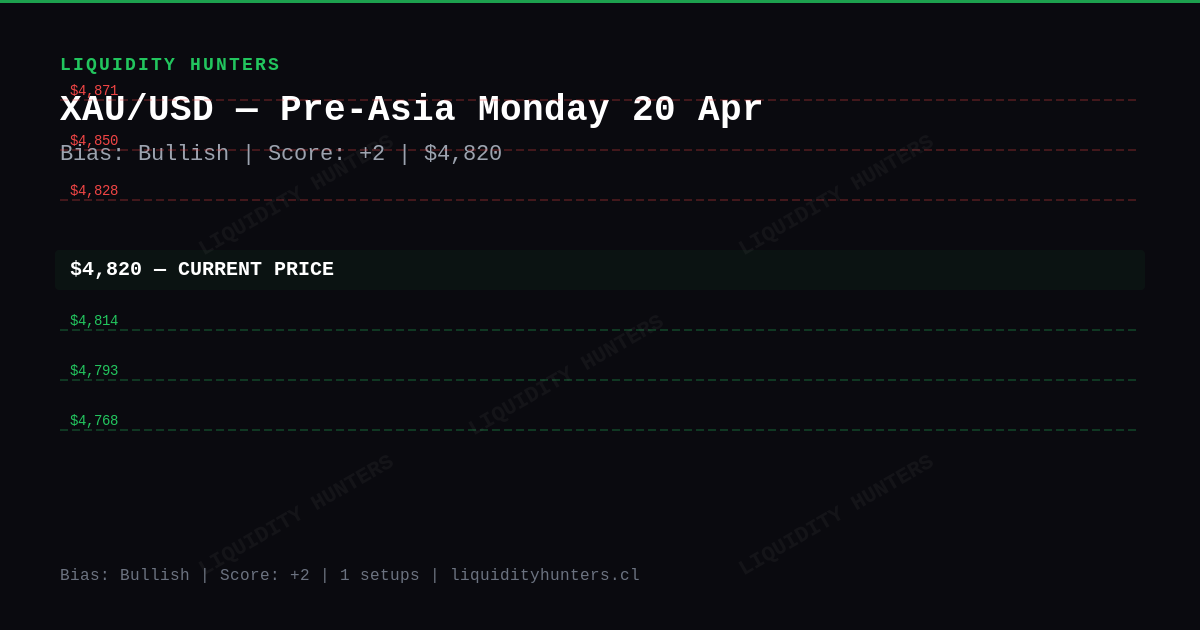
Key levels: R $4,828 / S $4,814. XAU/USD SMC/ICT analysis for the Pre-Asia session (April 20). Bullish bias (score +2), 1 active setup, support at $4,814.
Frequently Asked Questions
What is the XAU/USD bias for the Pre-Asia session today?
XAU/USD shows a bullish bias with score +2/10. Wyckoff phase is transition. Trade with the structural direction. Current price sits at $4,820.
What are the key resistance and support levels for XAU/USD today?
Immediate resistance sits at $4,828. Key support is $4,814. Higher resistance extends toward $4,892. Deeper liquidity pool near $4,737. Watch for reaction at each level for SMC/ICT confirmations.
What is the main XAU/USD long setup for the Pre-Asia killzone?
Main setup: LONG — Resistance breakout. Trigger: Breakout + retest of $4,828.
Where is the invalidation level for today's XAU/USD bias?
The bullish bias invalidates on a clean 1H close above $4,892 or below $4,737. Until then, trade with the structure. Avoid counter-trend entries without a CHoCH confirmation on M15 or higher.
What macro drivers are affecting XAU/USD today?
**DXY neutral (+0.05%)** — no significant direct pressure. **Silver -2.1%** — negative. Broad weakness in precious metals.
In summary
Gold held steady at $4,820. It was a moderately active day — price swung $41 between its low ($4,793) and high ($4,833).
The trend leans bullish (score +2), but with caution. If support breaks, the read changes.
Why? silver dropped 2.1% (a sign of weakness across metals).
Technical analysis
Gold closed Monday April 20 at $4,820 (climbed 0.00%). 4H structure: BULLISH. Wyckoff Ranging. Daily range: $41 ($4,793 - $4,833). Score: +2 Bullish.


The day in detail
Act 1 — Asia (21:00-04:00 Chile): Gold rose $40 (0.8%), from $4,755 to $4,796. Moderate range of $22. Typical Asia compression — energy built up for London.
Act 2 — London (04:00-09:00 Chile): Quiet session. Gold moved only $18 ($4,793-$4,811). No relevant moves.
Act 3 — NY (09:00-16:00 Chile): Gold rose $4 (0.1%), from $4,811 to $4,814. Moderate range of $35.
Act 4 — Close (16:00-21:00 Chile): Gold rose $8 (0.2%), from $4,814 to $4,822. Moderate range of $23. Close-session consolidation — volatility spent.
Correlations
DXY neutral (+0.05%) — no significant direct pressure.
Silver -2.1% — negative. Broad weakness in precious metals.
Market Maker
BSL (stops of shorts above): $4,833, $4,832, $4,831 SSL (stops of longs below): $4,793, $4,799, $4,800
Price near BSL $4,828. MM may sweep stops above and continue up. Second touch usually breaks.
Scenarios
Scenario 1 — Healthy pullback and continuation (50%): Gold pulls back to support zone-$4,800 and bounces. Buyers defend support. Continuation toward nearest resistance.
Scenario 2 — Range consolidation (30%): Gold stays between support zone-nearest resistance with no clear direction. Volume declines.
Scenario 3 — Support break (20%): Gold loses support zone with a 1H close below. Move back to $4,793. Cancel longs.
What to do
1 active setup. Favorite: LONG Resistance breakout.
The key support of the day is the line in the sand. If it holds, bullish continuation. If it breaks on a 1H close, cancel longs.
Analysis generated by the Liquidity Hunters team. This is educational content and not financial advice. Trading involves risk of capital loss.
What the team says
Our 8 analysts reviewed this report and all raised concerns. No consensus — it’s a tricky day.
Tu decides. Nosotros mostramos los datos y los desacuerdos. La decision final siempre es tuya.
Replay this day bar by bar in the simulator
Trade the same scenario risk-free: the replay starts on this date and the analysis levels activate on their own as you advance. When you close, the AI scores your decisions.
Open in the simulatorDisclaimer
Educational and informational content. This is not financial advice or a buy/sell recommendation. Trading involves risk of capital loss. Past results do not guarantee future results. Do your own research (DYOR).