XAU/USD Analysis Pre-New York Friday March 27 - Gold at $4,527, Bullish Bias
XAU/USD at $4,527 with bullish 4H structure in Wyckoff transition. 2 active setups. Score +1.

Summary
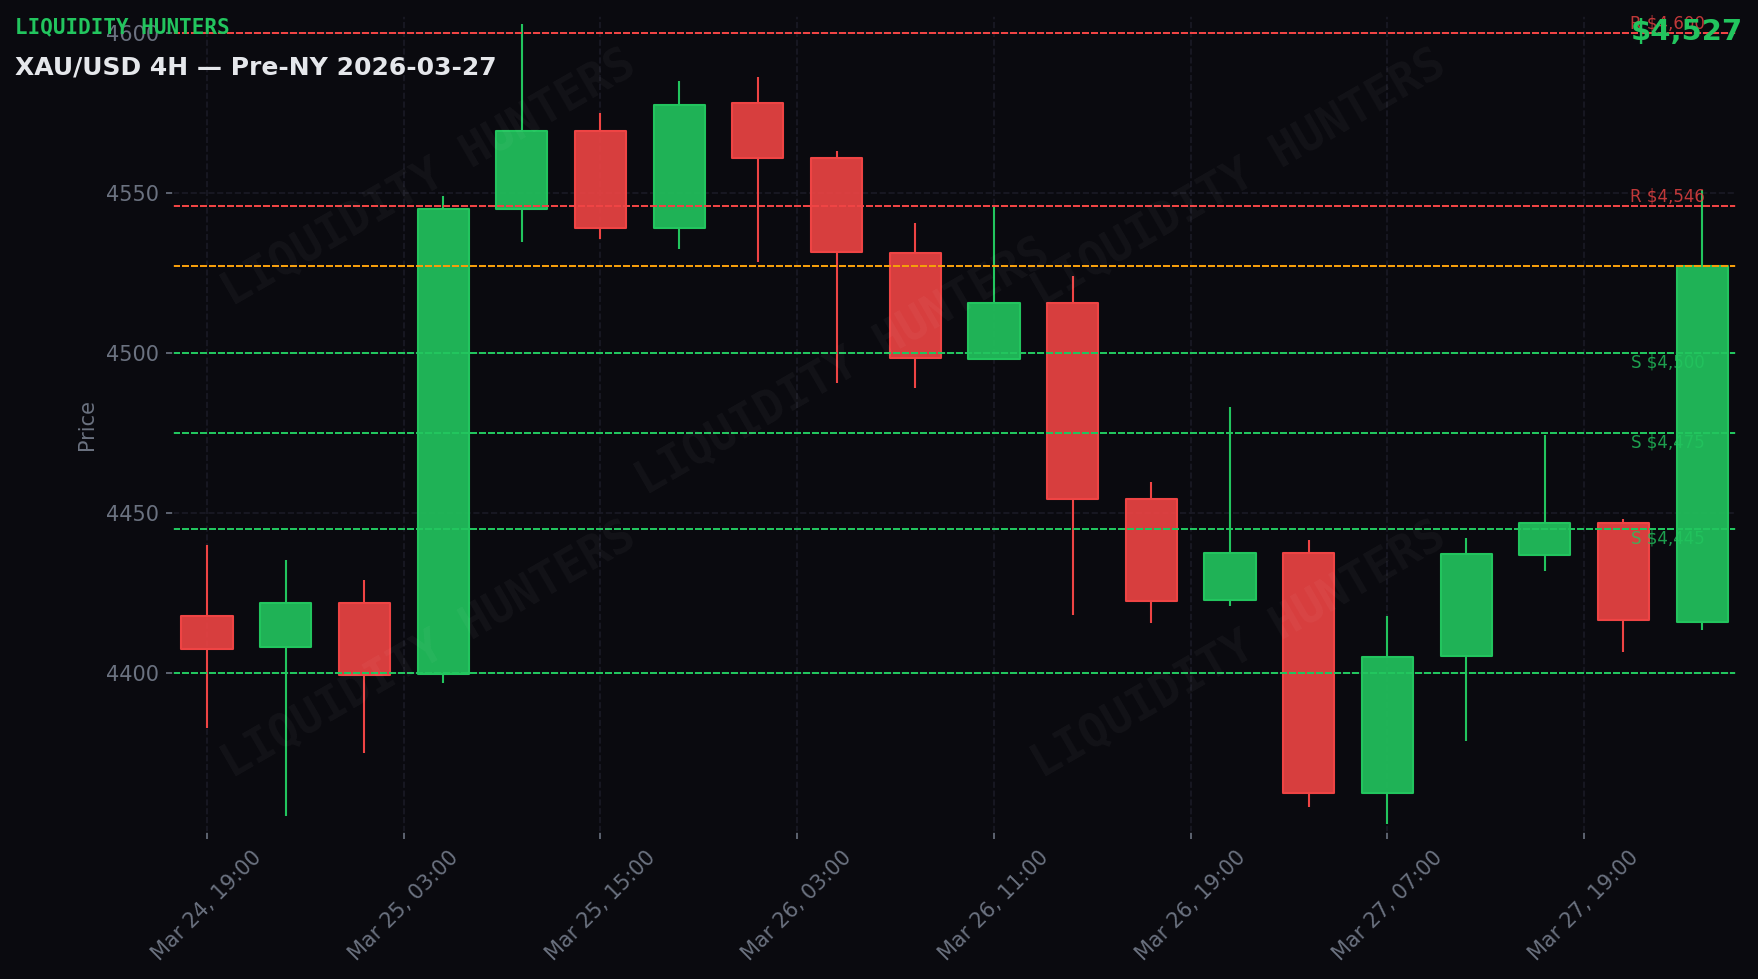
Gold rose 3.8% and closed at $4,527. It was a very volatile day — the price moved $144 between its lowest point ($4,407) and highest ($4,551).
The trend points upward (score +1), but with caution. If it loses support, the reading changes.
Watch Friday: the Fed’s preferred inflation data is released (2026-03-27 09:30 Chile). If inflation comes in low, gold rallies hard. If it comes in high, it can fall. It’s the most important data point of the week.
Premium content
Want the exact entry setups?
Subscribers receive before each session: exact entry and exit points, institutional liquidity map, and macro event alerts. You arrive at the market with a plan.
Technical Analysis
Gold closed Friday, March 27 at $4,527 (up 3.77%). 4H Structure: BULLISH. Wyckoff Ranging. Daily range: $144 ($4,407 - $4,551). Score: +1 BULLISH.
The Day in Detail
Act 1 — Asia (21:00-04:00 Chile): Bearish pressure. Gold down $68 from $4,431 to $4,363. Range of $77 with low at $4,407. The 03:00 UTC candle was the largest ($83 range).
Act 2 — London (04:00-09:00 Chile): Quiet session. Gold moved only $11 ($4,407-$4,418). No significant moves.
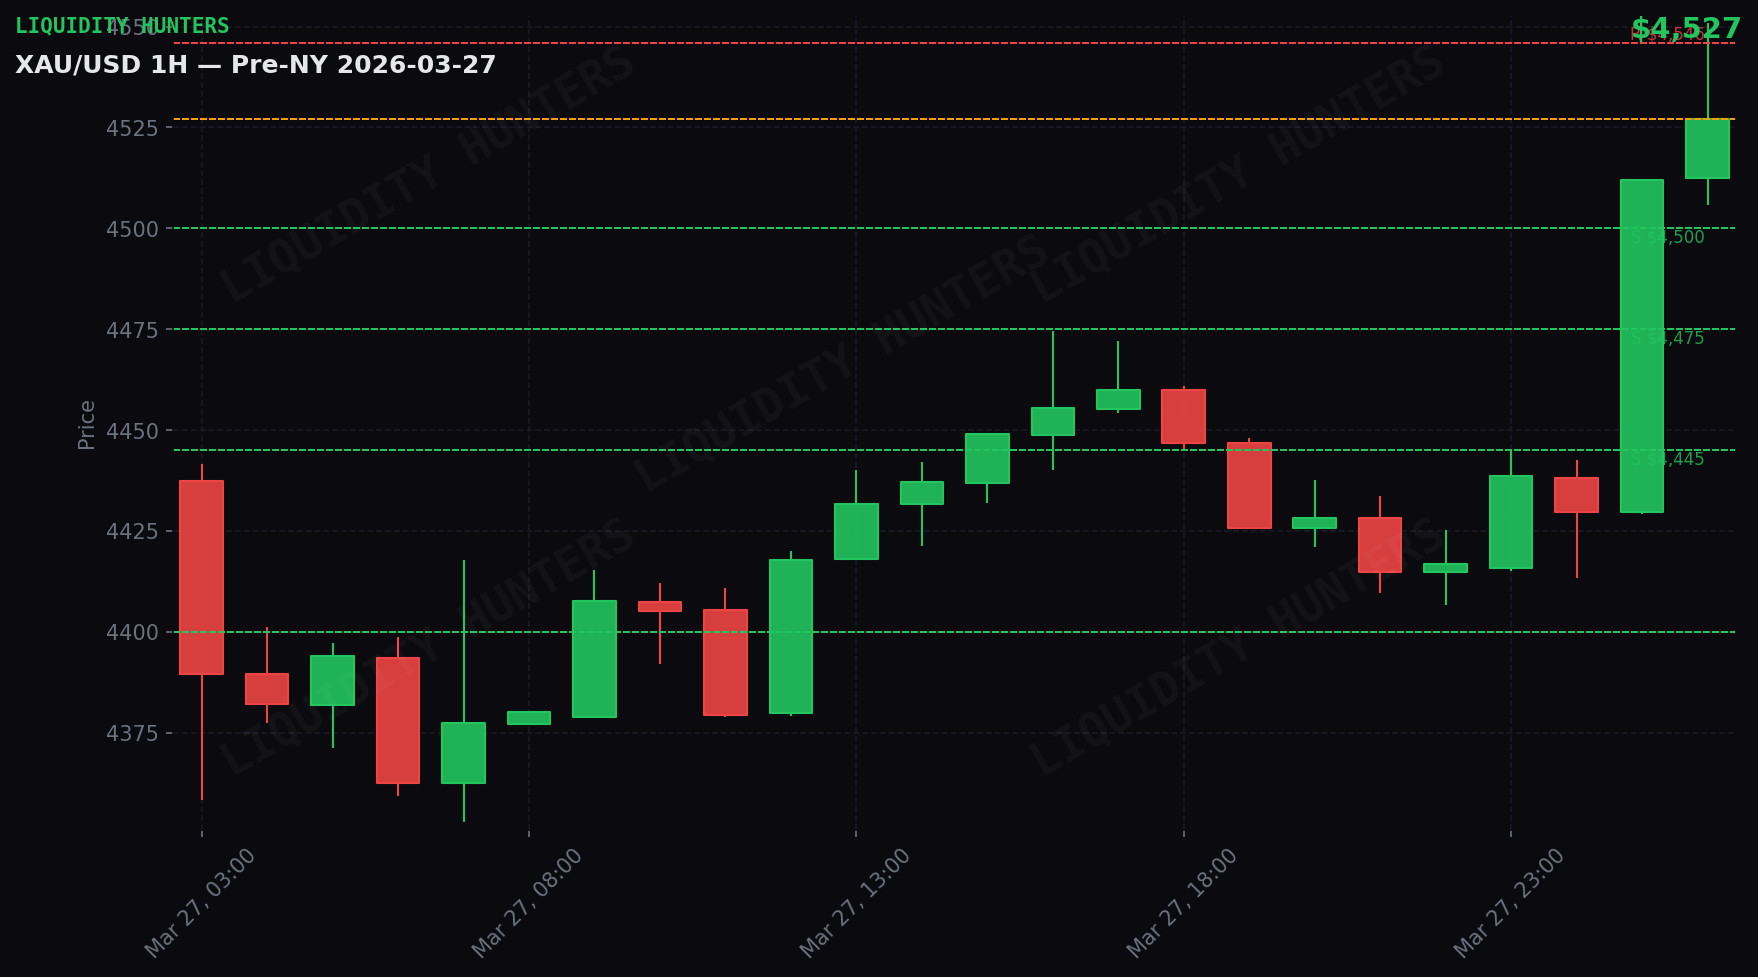
Act 3 — NY (09:00-16:00 Chile): Strong upward move. Gold up $67 from $4,380 to $4,447. Range of $68 with high at $4,475. The 12:00 UTC candle was the largest ($41 range).
Volatility ELEVATED
Daily ATR $153 vs normal $122 (1.3x). Moves are faster and sweeps more aggressive. SL adjusted x1.25, reduced risk.
Correlations
DXY neutral (+0.00%) — no significant direct pressure.
Market Maker
Institutions are accumulating on pullbacks. Liquidity sweeps are buy opportunities, not signs of weakness.
The complete Market Maker reading (BSL/SSL, institutional game and scenarios) is available in the premium plan.
Scenarios
Scenario 1 — Healthy pullback and continuation (50%): Gold pulls back to support zone-$4,507 and bounces. Buyers defend support. Continuation toward next resistance.
Scenario 2 — Range consolidation (30%): Gold stays between support-next resistance zone with no clear direction. Volume drops.
Scenario 3 — Support break (20%): Gold loses support zone with 1H close below. Return to $4,475. Cancel longs.
What to Do
2 active setups. Favorite: LONG Pullback to support. Entry, SL and TP exact available in the premium plan.
The key support of the day is the line of defense. If it holds, bullish continuation. If it breaks with 1H close below, cancel longs. Exact levels in the premium plan.
Critical event: Core PCE Price Index — 2026-03-27 09:30 Chile. Reduce exposure before the data.
Analysis generated by the Liquidity Hunters team. This analysis is educational and is not financial advice. Trading carries the risk of capital loss.
Informes pre-sesión con setups de entrada
Antes de cada sesión recibes los setups probables con entry, SL y TP exactos, correlaciones con DXY, Oil y Yields, noticias macro del día, y mapa de liquidez. Llegas al mercado con un plan.
Disclaimer
Educational and informational content. This is not financial advice or a buy/sell recommendation. Trading involves risk of capital loss. Past results do not guarantee future results. Do your own research (DYOR).